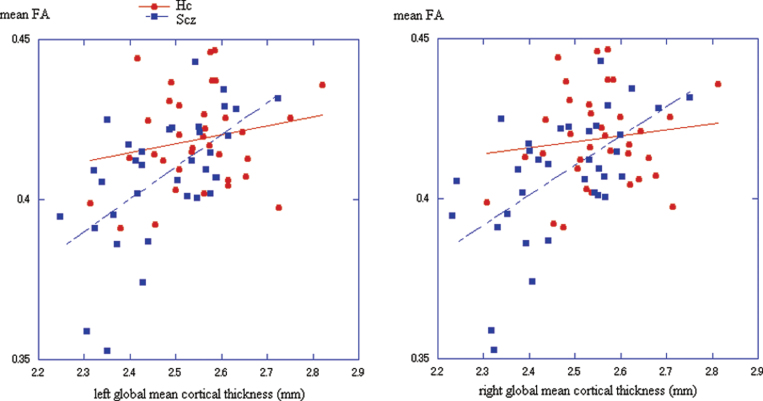
Fig. 3.
Scatter plot of the mean FA and global mean cortical thicknesses in healthy controls (Hc: red) and schizophrenia patients (Scz: blue) for each hemisphere.
Left panel: left hemisphere. Hc: r = 0.199, P = .25, Scz: r = 0.587, P < .001.
Right panel: right hemisphere. Hc: r = 0.127, P = .47, Scz: r = 0.580, P < .001.

