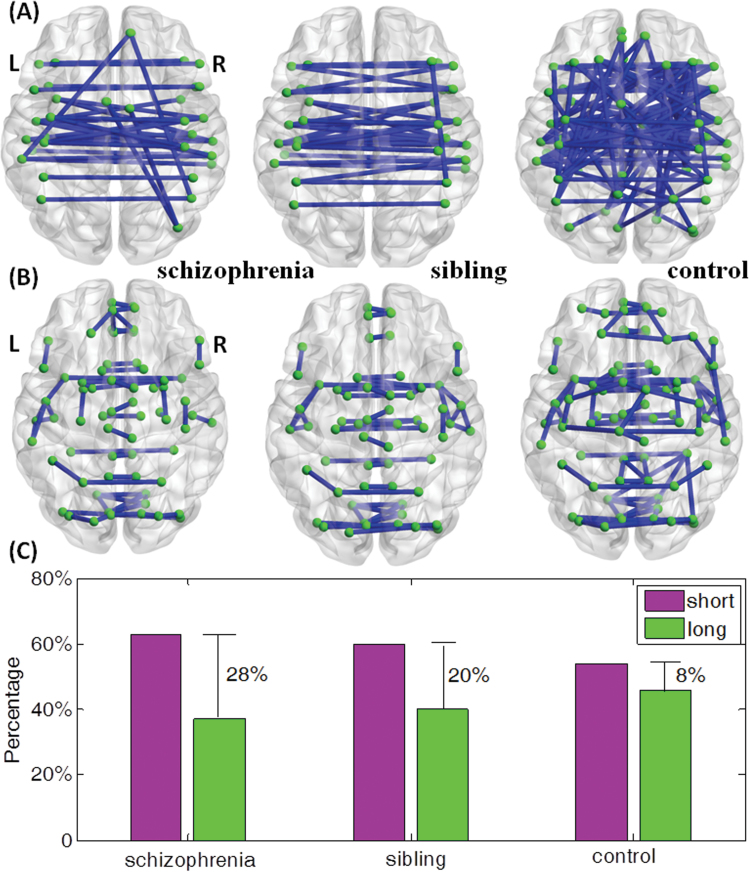
Fig. 2.
We wish to print this figure with color reproduction too. The top 10% of significant long links from 1-sample t tests within each group are displayed in panel (A). There are 29 long links within schizophrenia group, 31 long links within sibling group, and 76 long links within controls. The top 10% of significant short links within each group are displayed in panel (B). There are 49 short links within schizophrenia group, 47 short links within sibling group and 92 short links within controls. (C) Bar plot of the proportional difference of short links and long links within each group displaying the difference between P-short and P-long shown in table 2.

