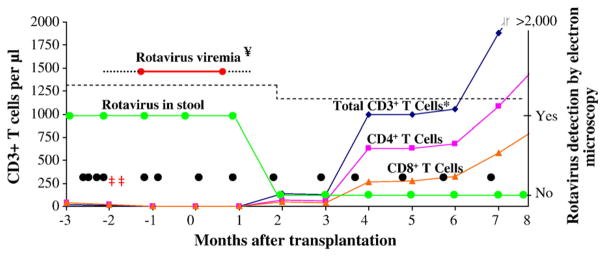
Figure 1.

The detection of rotavirus in relation to the presence of CD3+,CD4+, and CD8+T-cell quantification before and after bone marrow transplantation. *=CD3+T cells were 100% donor origin calculated by short tandem repeat studies; ¥=Several serum samples were positive for rotavirus by RT-PCR prior to transplantation; ‡‡=Oral IG administered in 2 separate doses; • =IVIG dose; (···········)=negative rotavirus viremia. The 10th percentile normal values for age for CD3+T cells is represented by (– – – – – –) [11].
