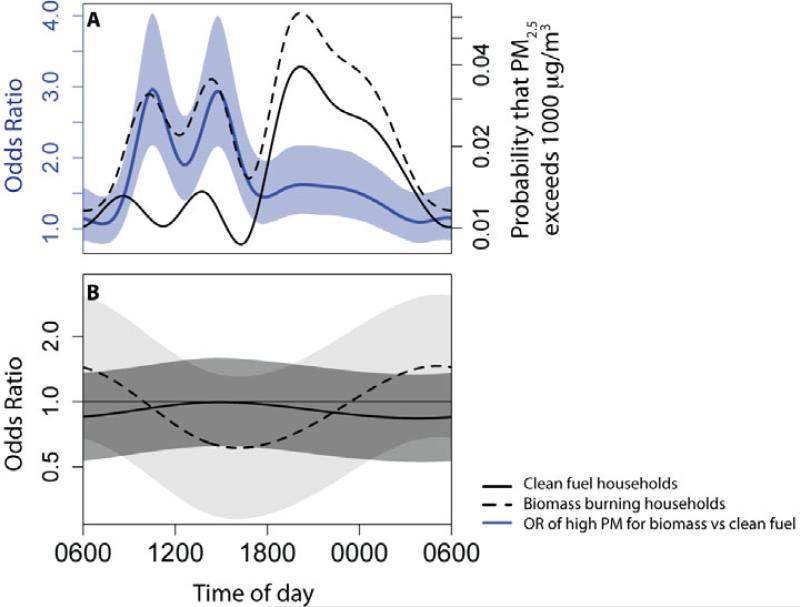
Figure 2. Variation in the effects of (A) biomass use and (B) having more than two external windows and doors throughout a 24-hour period on the odds of PM2.5 concentrations exceeding 1000 μg/m3 for biomass and clean fuel households.
(A) Model estimates of the probability that PM2.5 exceeds 1000 μg/m3 in clean fuel households (solid line) and biomass households (dashed line). The blue line is the odds ratio of PM2.5 exceeding 1000 μg/m3 between the two household types. (B) Odds ratio of PM2.5 exceeding 1000 μg/m3 in households with more than two external windows and doors versus households with fewer external windows and doors for clean fuel households (solid line) and biomass households (dashed line). The shaded areas are 95% confidence intervals.

