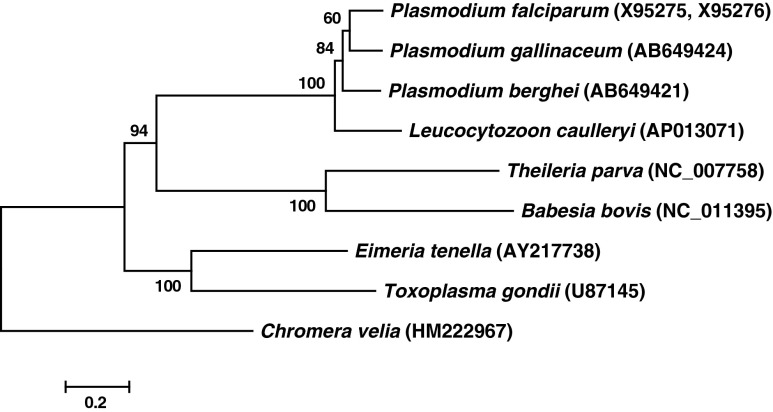
Fig. 2.
Phylogeny of the apicoplast genomes. Amino acid sequences specified by the 10 selected plastid-encoded genes were concatenated for each species, and the phylogeny was analyzed by the maximum likelihood method with the JTT + F + Γ model to obtain the dendrogram. Numbers at nodes indicate bootstrap values from 1,000 replicates. The scale bar indicates 0.2 substitutions per site. The accession numbers of the nucleotide sequence data, from which the amino acid sequences used in the analysis were deduced, are given in parentheses after the name of each taxon

