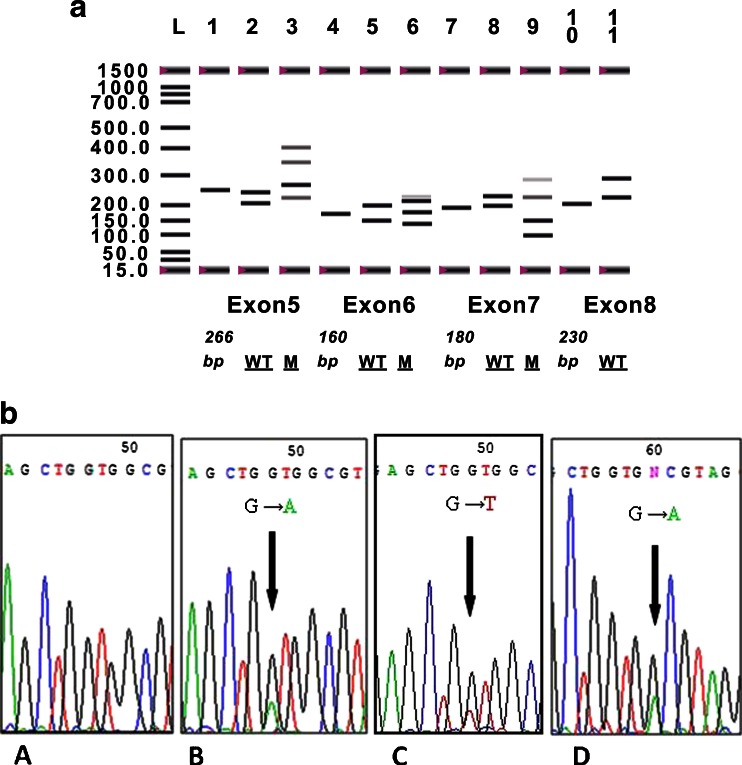
Fig. 3.
a Single-strand conformational polymorphism analysis of exons 5, 6, 7, and 8 of the p53 gene. Lanes L, ladder at 1,500 bp; 1, exon 5 tumoral sample with 266-bp band; 2, exon 5 WT; 3, exon 5 sample with mutated band; 4, tumoral sample of exon 6 with 160-bp band; 5, exon 6 sample with Wild Type; 6, exon 6 sample with mutated band; 7, tumoral sample of exon 7 with 180-bp band; 8, exon 7 sample with wild type; 9, exon 7 sample with mutated band; 10, tumoral sample of exon 8 with 230-bp band; and 11, exon 8 sample with wild type. M mutated, WT wild type. b Partial electropherograms representing the normal and mutant profiles of exons 5, 6, and 7. A, Insertion of T. B, Insertion of C. C, transition of G to A leading to a frame-shift mutation

