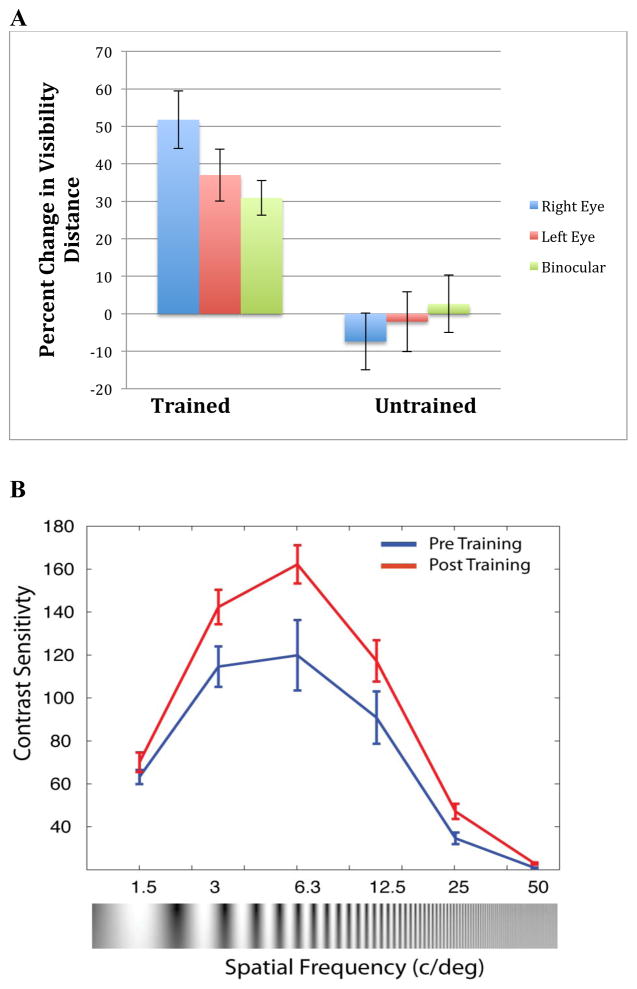
Figure 1. Changes in Acuity and Contrast Sensitivity.
(A) change in distance the same text can be read from the pre-test to the post-test in the Trained and Untrained UCR players. (B) change in Contrast Sensitivity Function assessed using a computer program that staircased contrast in an orientation matching task for centrally presented Gabor patches of six different spatial frequencies (1.5, 3, 6, 12.5, 25 and 50 cpd). Y-axis, contrast sensitivity; higher score represents better ability to see low contrasts. X-axis, the spatial frequency. Error bars represent within subject standard error.

