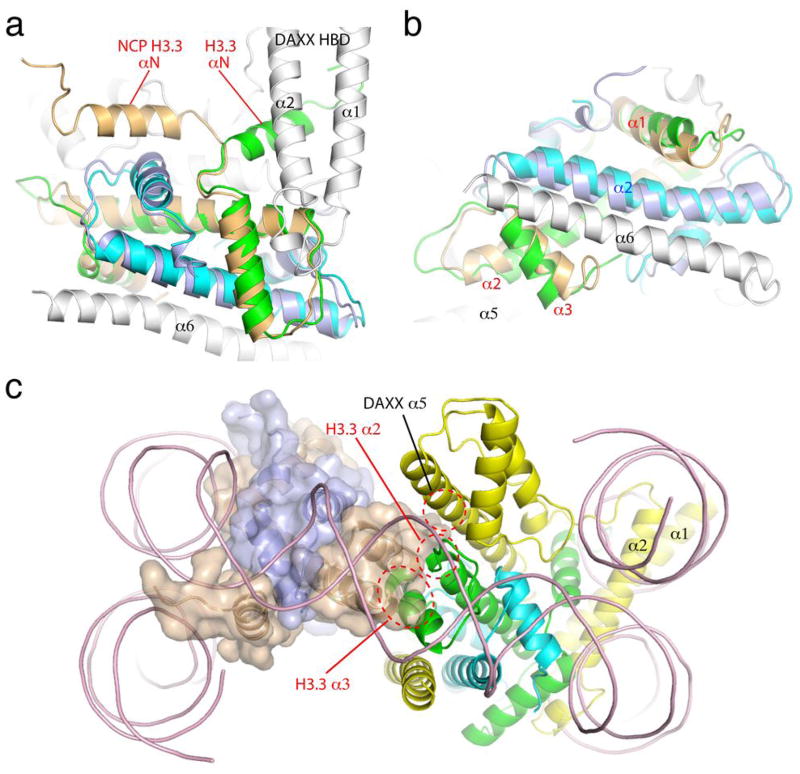
Figure 2.
Conformational differences between the DAXX HBD-bound and nucleosomal H3.3-H4 complexes. (A) An H3.3-H4 dimer from the NCP structure (PDB 3AV2), with H3.3 and H4 colored in wheat and light blue, respectively, is superimposed with the DAXX HBD-H3.3-H4 complex. (B) Superimposed structures viewed from a direction perpendicular to that in Figure 2A (looking up from the bottom). (C) A model replacing one nucleosomal H3.3-H4 heterodimer with that from the DAXX HBD complex (ribbon only). The other nucleosomal H3.3-H4 complex is shown in a semi-transparent surface representation superimposed onto a ribbon model. The coloring scheme is the same as in (A) and (B), except that DAXX is colored yellow here. Regions of spatial hindrance for the formation of an H3.3-H4 tetramer are indicated with red dashed-line circles.

