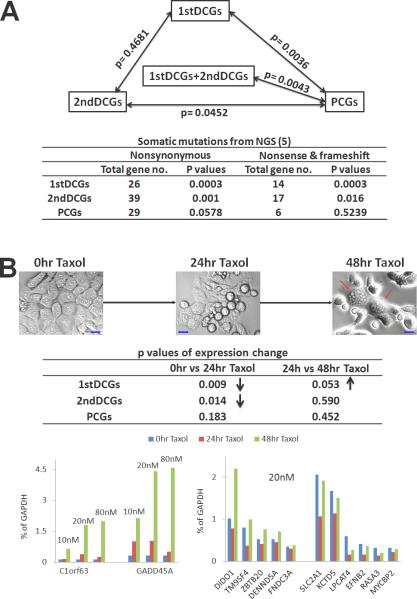
Fig. 2. DCGs significantly differ from PCGs in cancer relevance examined.
A) The top triangle shows the Hotelling's T-squared test results performed with the data documented in Supplementary Table s1 and described in the text. The numbers shown between the boxes are p-values from the tests. The table below indicates the somatic mutation status reported by a recent NGS study with 276 human CRCs (5) for each group of our candidate genes (see Supplementary Table s4 for details).
B) DCGs and PCGs responding differently in their mRNA expression changes to Taxol-treatment of HCT116 cells. The treatment of 20nM Taxol for 24 hours and 48 hours induced HCT116 cell death and cell cycle arrest (demonstrated by the multinucleate cells indicated with red arrows) (Top). The overall gene expression change at 20nM Taxol between different treatment times was indicated by the p-values, obtained from t-tests using data from Supplementary Table s5 and with “↑” representing significant increase and “↓” indicating significant decrease (middle) (see Supplementary Fig. s2 for p-values of DCGs/PCGs separated based on whether they were amplified or deleted in CRCs). The bottom shows the expression change of individual DCGs, including GADD45A and C1orf63 with similar drug-response profiles, as well as those having a slight expression decrease at 24 hours followed by a larger increase or a near complete recovery at 48 hours. Similar gene expression trends were observed for 10nM and 80nM Taxol treatment (see Supplementary Table s5).

