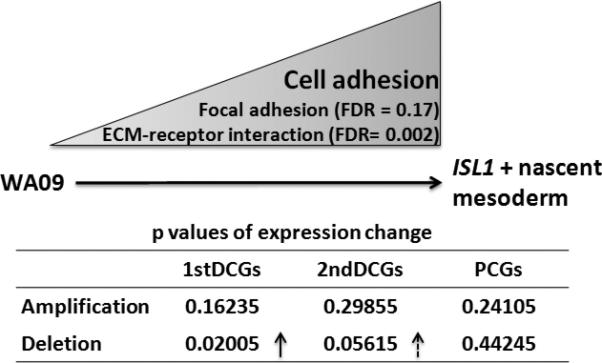
Fig. 5. Expression changes of DCGs and PCGs in an in vitro hESC differentiation system.

During this differentiation cell-cell/cell-ECM adhesions are establishing, demonstrated by microarray expression studies (see the main text). The expression level of individual genes of 1stDCGs, 2ndDCGs, and PCGs in hESC WA09 and its differentiated ISL1+ nascent mesoderm was determined by qRT-PCR (Supplementary Table s11). T-tests were then performed to determine the significance of the expression difference for the genes of each group, which were further separated depending upon if a gene was predominantly amplified (indicated by “Amplification” in the image) or deleted (indicated by “Deletion”) in CRCs examined (Supplementary Tables s1 & s11), between the two cell types. “↑” indicates a significant increase in gene expression.
