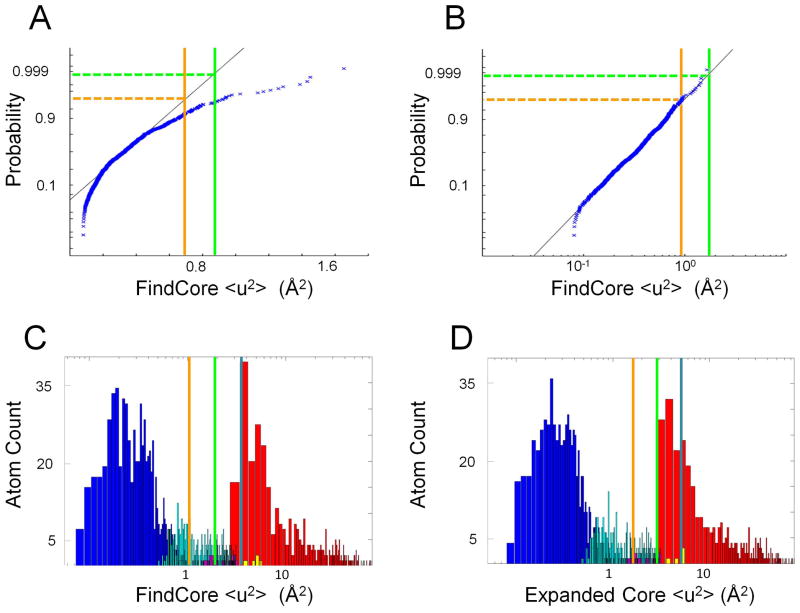
Figure 1. Lognormal distribution of core atom <u2> values.
All plots were made using the heavy atoms of NMR ensemble target T0655 (2LUZ) as an example. (A) Normal QQ plot of <u2> values (calculating using the FindCore superimposition) for FindCore core atoms in T0655 demonstrating a lack of normality in the <u2> statistic. (B) Normal QQ plot of log(<u2>) values for the same core atom set demonstrating the lognormal distribution of the <u2> statistic. (C,D) Histograms (with a logarithmic scale for the abscissa) of <u2> values for heavy atoms in T0655, with <u2> calculated from (C) the original FindCore superimposition and (D) the superimposition calculated in the first iteration of the Expanded FindCore method. Blue bars correspond to atoms in the original FindCore core, cyan bars to atoms added to the core in the iteration process, magenta bars to atoms removed from the core during the editing process, which ensures all atoms in the final core belong to residues for which all backbone atoms are in the core. Yellow bars correspond to carbonyl oxygens added to the core in the editing process. The orange, green and blue lines mark Z score cut-offs of 2, 3 and 4 respectively. Note that the Z score = 3 cut-off (green lines) is (B) a tight upper boundary for the distribution of <u2> values for the core atom set and (D) is a tight lower boundary for the second (non-core) mode of the distribution of <u2> values calculated using the final Expanded FindCore superimposition.

