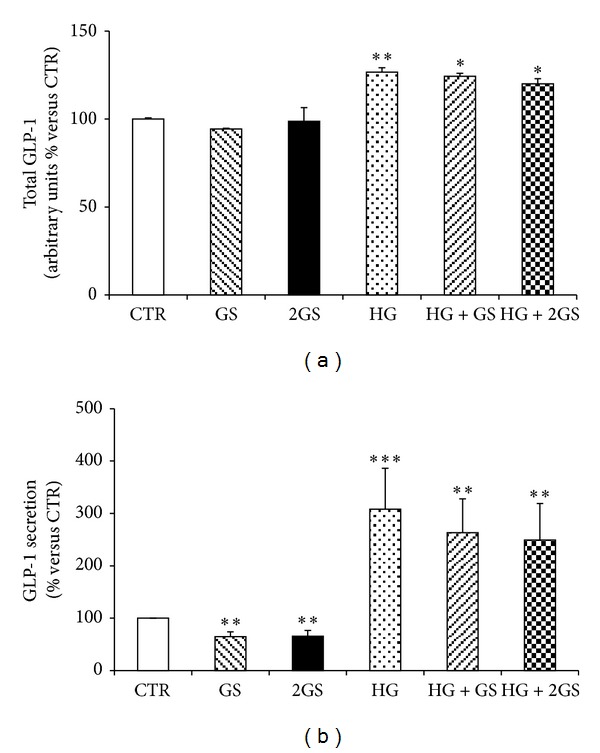
Figure 3.

HG increases GLP-1 total production and release. Levels of total GLP-1 production (a) (calculated as the sum of the supernatant and cell content of GLP-1) and GLP-1 released (b) in the supernatants were shown. Data are expressed as mean ± SE (n = 5). *P < 0.05, **P < 0.01, and ***P < 0.001 versus CTR.
