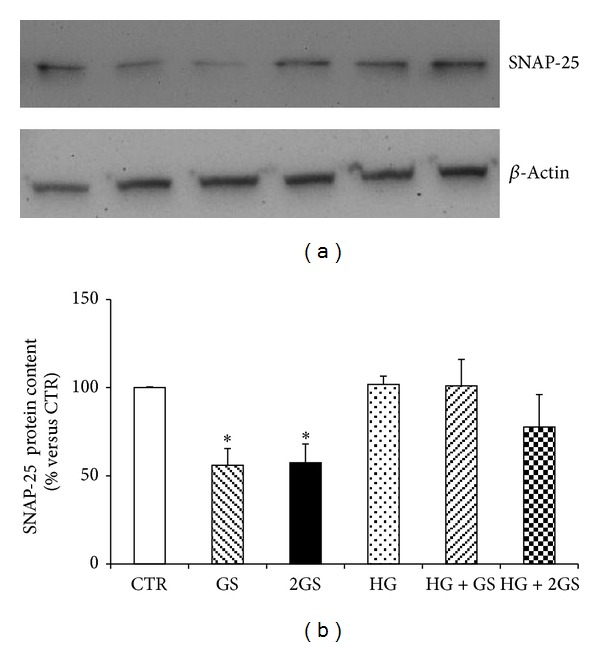
Figure 5.

GS decreases SNAP-25 protein content. (a) Representative western blot analysis. (b) Quantification of densitometries of western blot bands. Data were expressed as mean ± SE of fold induction relative to β-actin (n = 4). *P < 0.05 versus CTR.
