
Figure 1.
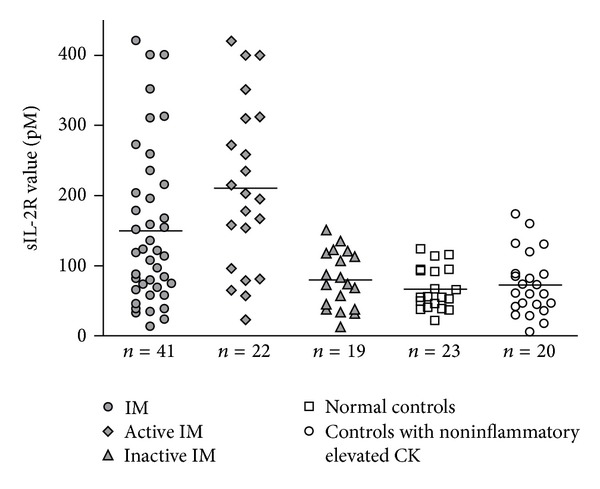
Serum sIL-2R values from 27 patients with IM, 20 normal control subjects, and 23 controls with noninflammatory elevated CK. Each data point represents the sIL-2R value and horizontal bars represent the mean for each group.
Official websites use .gov
A
.gov website belongs to an official
government organization in the United States.
Secure .gov websites use HTTPS
A lock (
) or https:// means you've safely
connected to the .gov website. Share sensitive
information only on official, secure websites.
Serum sIL-2R values from 27 patients with IM, 20 normal control subjects, and 23 controls with noninflammatory elevated CK. Each data point represents the sIL-2R value and horizontal bars represent the mean for each group.