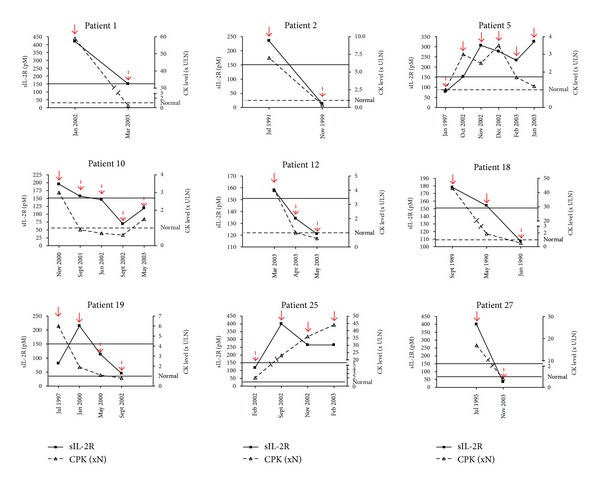
Figure 2.

Correlation between serial measurements of sIL-2R and CK levels (times the upper limit of normal (x ULN)) for 9 patients at different time points. Red full arrows represent active disease and red dotted arrows inactive disease. For sIL-2R, the black line shows the cutoff value of 151 pM. For CK level, dotted line shows the normal value.
