Figure 1.
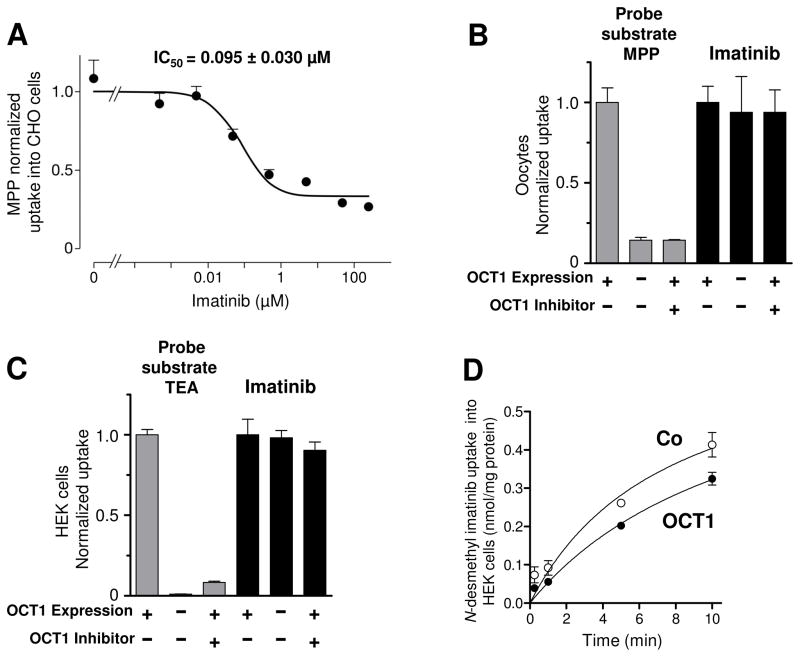
Assessment of imatinib as inhibitor and substrate of OCT1. A, uptake (1 sec incubation) of OCT1 probe substrate [3H]MPP (0.1 μmol/L) into CHO-OCT1 cells in the presence of different imatinib concentrations. Data are normalized to uptake measured in the absence of imatinib and given as means ± SD from 3 experiments, each performed in quadruplicate. B, uptake of OCT1 probe substrate [3H]MPP (12 nmol/L) or of [14C]imatinib (1 μmol/L) into OCT1-expressing or non-expressing oocytes was measured after 30 minutes. Uptake was measured in the absence (−) or presence (+) of the OCT1 inhibitor tetrabutyl ammonium (TBuA, 1 mmol/L). Data are normalized means ± SE of 5 separate experiments, in each of which 7–10 oocytes were analyzed per experimental condition. C, uptake of OCT1 probe substrate [14C]TEA (100 μmol/L; means ± SD of 3 determinations) or of imatinib (2 μmol/L; means ± SE of 3 determinations performed in triplicate) into OCT1-expressing HEK cells or vector-transfected HEK cells (no OCT1 expression) was measured after 10 minutes. Uptake was measured in the absence (−) or presence (+) of the OCT1 inhibitor decynium22 (5 μmol/L). D, time-dependent uptake of the main metabolite N-desmethyl imatinib (10 μmol/L) into OCT1-expressing HEK cells and vector-transfected control cells (Co). Data are means ± SD of 3 determinations.

