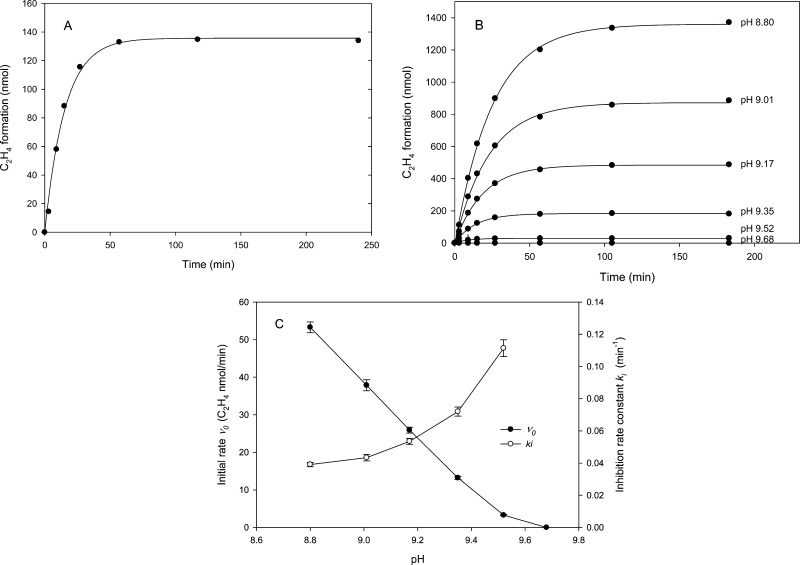
Figure 1.
Acetylene reduction activity as measured in the head space assay. Assays contained 0.25 mg of Av1 with a CR of 2.5 at 30 °C. (A) Time course of ethylene production in the head space generated at pH 9.5. The solid line was generated by curve fitting time points using eq 1. (B) Time course of ethylene production at various pHs over the range of 8.80–9.68. (C) Initial rate (v0) and inhibition rate constant (ki) calculated according to eq 1 for the assays that generated the data depicted in panel B. Error bars show standard errors estimated from the curve fitting.

