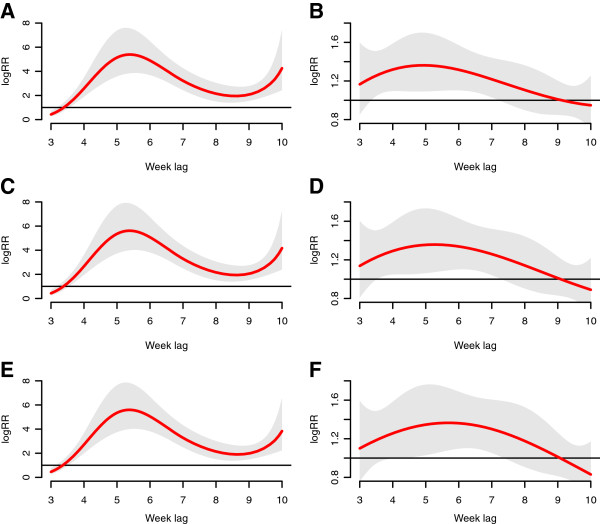
Figure 5.
The estimates of distributed lag between minimum temperature and malaria cases. The red line is the estimated distributed lag, with shaded bands indicating its 95% confidence interval. A &B show the scenario for 11.72°C weekly mean minimum temperature; C &D show the scenario for 14.26°C weekly mean minimum temperature, and E &F show the scenario for 16.8°C weekly mean minimum temperature. A, C and E are in the hot weather counties, while B, D, F are in cold weather counties.

