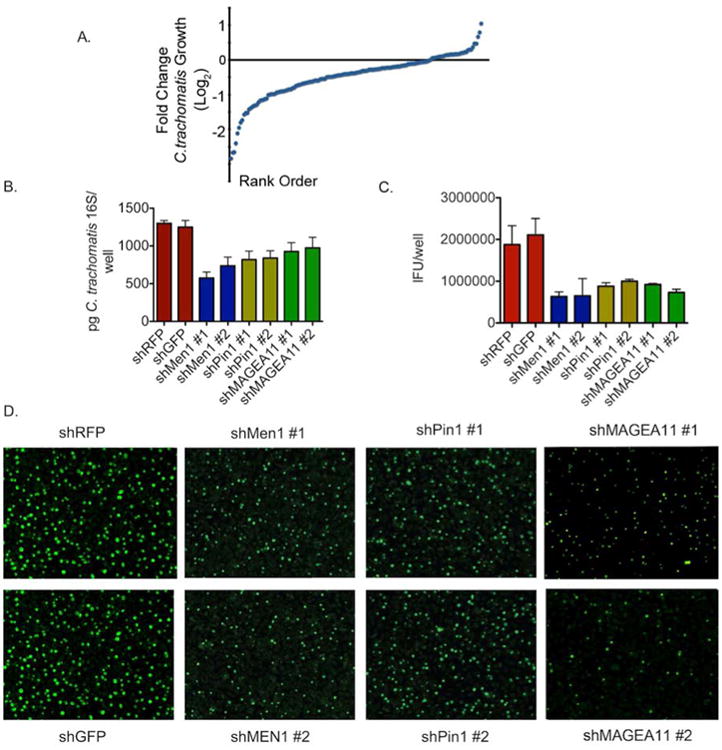
Figure 2. Loss-of-function screen identifies host proteins that are necessary for C. trachomatis propagation.

A) Distribution of the mean fold-change in C. trachomatis IFU production in experimental siRNA knockdown cell lines relative to negative controls.
B) A subset of stable shRNA knockdown cell lines was infected with C. trachomatis for 48 hours. Levels of C. trachomatis were determined by qPCR of the 16s gene and compared to non-targeting controls. The graphs show the mean levels of C. trachomatis from two independent hairpins +/- the standard. Shown is one of four independent experiments (n=4).
C) A subset of stable shRNA knockdowns was infected with C. trachomatis for 48 hours. Levels of C. trachomatis were determined by IFU production and compared to non-targeting control hairpins. The graphs show the mean IFU of C. trachomatis produced +/- the standard deviation for each individual hairpin. All experimental hairpins are p<.05 compared to control knockdown by one way ANOVA. Shown is one of four independent experiments (n=4).
D) Representative immunofluorescence micrographs from IFU analysis in (D) (Magnification 10×) from one of three independent experiments (n=4). See also Figure S2 and Table S3
