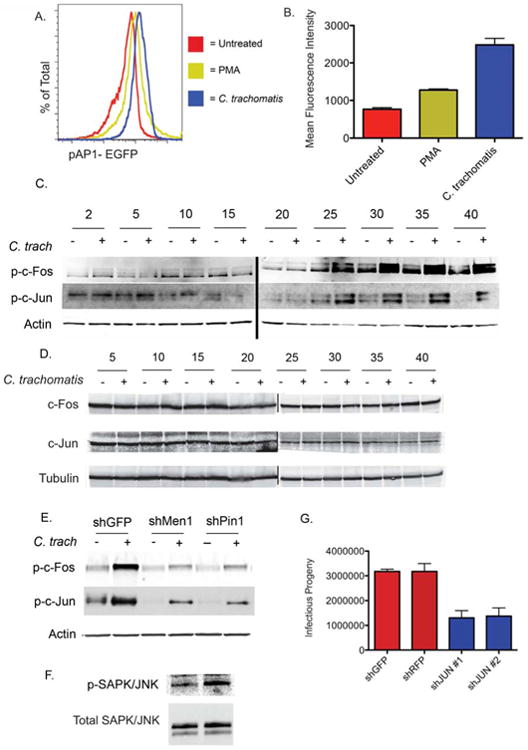
Figure 3. C. trachomatis infection leads to the activation of the AP-1 complex.

A) pAP-1 EGFP reporter cells were mock-infected, infected with C. trachomatis, or treated with PMA. Thirty hours later EGFP expression was determined by flow cytometry; A representative plot overlaying the three conditions is shown from three experiments (n=3).
B) Quantification of the mean-fluorescence intensity for each condition from (A) +/- the standard deviation (n=3). Both PMA and infection are p<.05 compared to Mock by two-tailed students t-test. Shown is a representative experiment from three completed.
C) Immunoblot analysis of and phosphorylated (top) c-Fos and (Bottom) c-Jun in mock-infected HeLa cells or HeLa cells infected with C. trachomatis every five hours for 40 hours. Loading was normalized to Actin. Shown is representative blot from one of three independent experiments.
D) Total c-Jun and c-Fos remain unchanged during infection with Chlamydia. HeLa cells were infected with Chlamydia or mock-infected. At the indicated timepoints cells were lysed and analyzed for total levels of c-Fos and c-Jun. All lysates were normalized using tubulin. Shown is a representative blot from three independent experiments.
E) Indicated shRNA knockdown cells were infected or mock-infected with Chlamydia for 40 hours. Cells were lysed and the levels of phosphorylated c-Fos and c-Jun were determined by immunoblot. Loading was normalized to host Actin. Shown is representative blot from one of three independent experiments.
F) Immunoblot analysis of HeLa cells infected mock-infected or infected with C. trachomatis for 30 hours to determine the levels of total SAPK/JNK (bottom) and phosphorylated SAPK/JNK (top). Shown is a representative blot from four independent experiments.
G) shJUN knockdowns were infected with C. trachomatis for 48 hours. Levels of C. trachomatis were determined by IFU production and compared to non-targeting control hairpins. The graphs show the mean IFU of C. trachomatis produced +/- the standard deviation for each individual hairpin (n=6). Shown is one representative experiment from two completed. All experimental hairpins have p<.05 compared to control knockdown by one way ANOVA. See also Figure S3.
