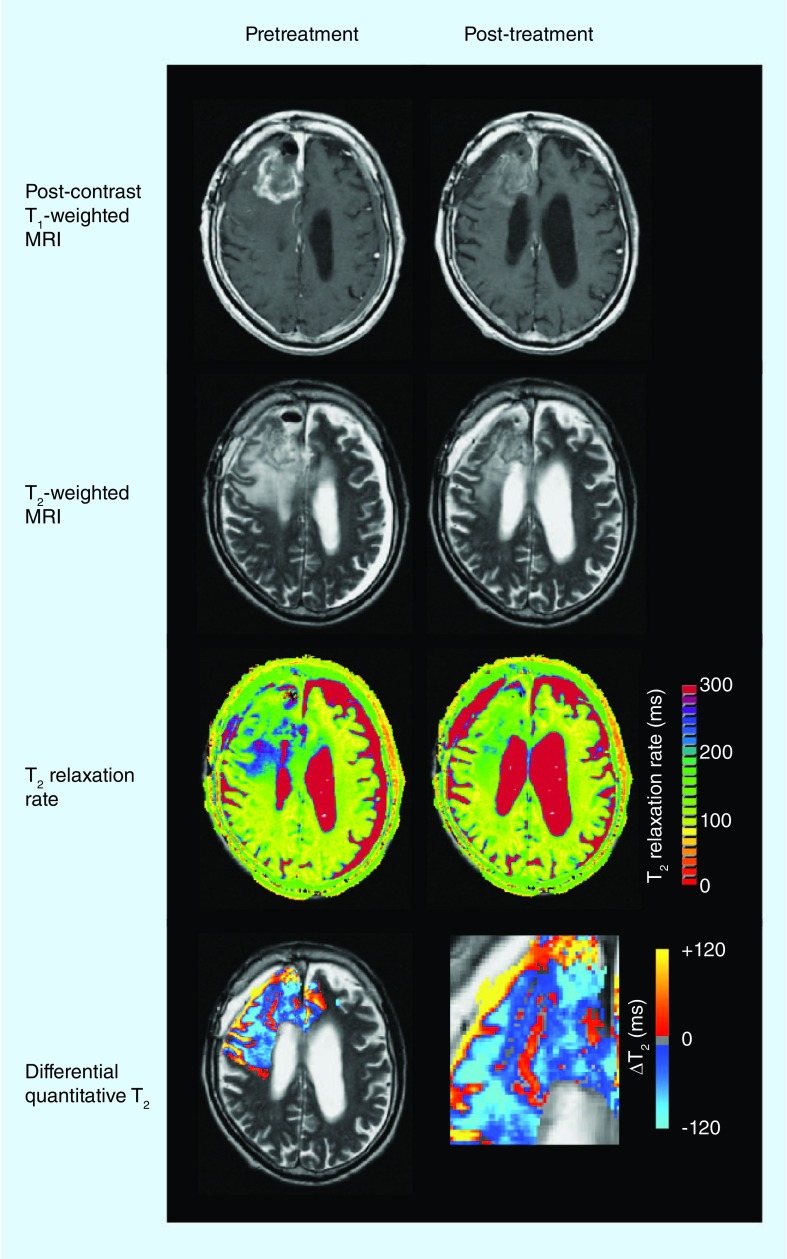
Figure 2. Differential quantitative T2 response to antiangiogenic therapy.
T2 relaxation rate color maps are calculated using multiecho fast spin-echo acquisition. Differential quantitative T2 images illustrate the voxelwise difference in T2 measurements. Note that T2 has increased along the right boundary of the contrast-enhancing lesion, as shown in red.

