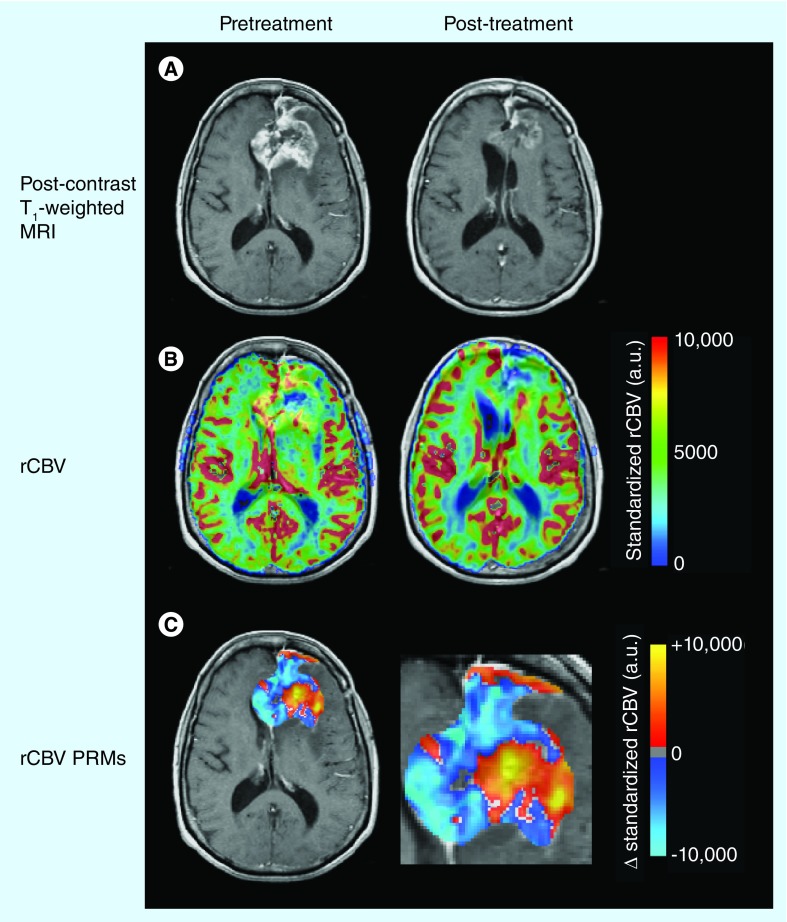
Figure 3. Effects of antiangiogenic therapy on relative cerebral blood volume.
(A) Post-contrast T1-weighted magnetic resonance images. (B) Leakage-corrected and standardized rCBV color maps. (C) rCBV PRMs showing voxelwise changes in rCBV after antiangiogenic therapy. Red/yellow indicates an increase in rCBV, while blue/cyan indicates a decrease.
PRM: Parametric response map; rCBV: Relative cerebral blood volume.

