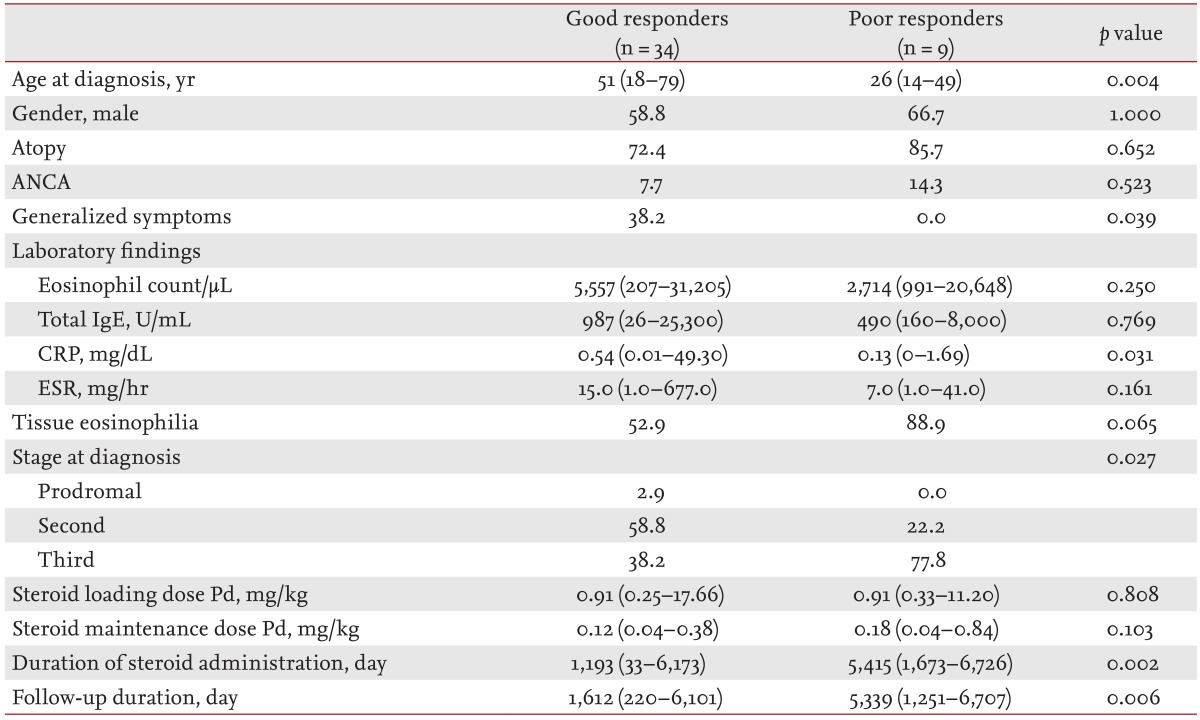
Table 5.
Comparison of clinical features according to treatment response

Values are presented as medians with range (minimum-maximum) or percentage. Mann-Whitney U tests and Fisher exact tests were used to calculate p values.
ANCA, antineutrophil cytoplasmic antibody; IgE, immunoglobulin E; CRP, C-reactive protein; ESR, erythrocyte sedimentation rate; Pd, prednisolone.
