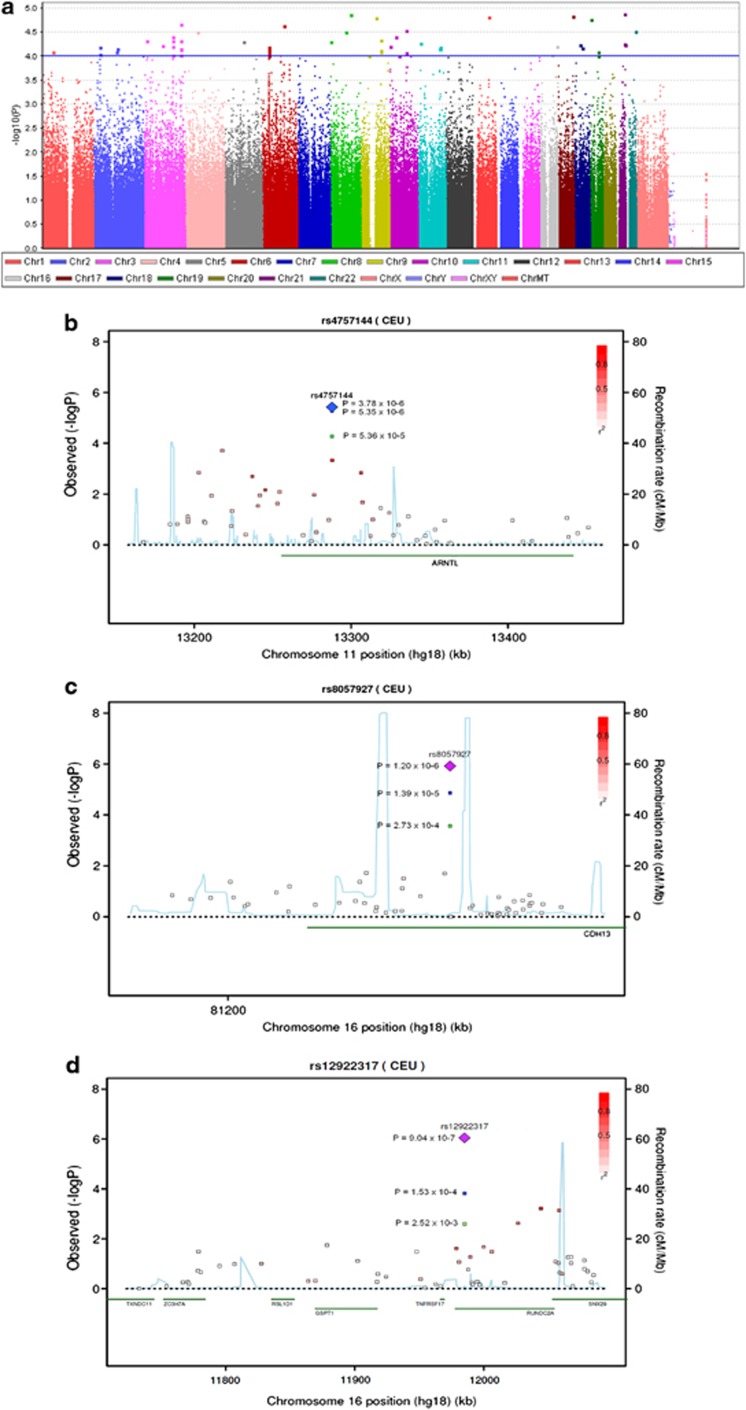
Figure 1.
(a) Manhattan plot of genome-wide association (GWA) analysis. The blue line indicates P=1 × 10⁻⁴. (b) Regional association plot of rs4757144 located in ARNTL. (c) Regional association plot of rs8057927 located in CDH13. (d) Regional association plot of rs12922317 located in RUNDC2A. The P-values in green are from the GWA analysis, P-values marked in blue are from the combined analysis of Danish individuals, P-values marked in purple are from the extended meta-analysis. The linkage disequilibrium (LD; r2) between the SNP in focus and its flanking markers genotyped in the GWA study are demonstrated in red (high LD) to white (low LD). The recombination rate is plotted in blue according to HapMap (CEU).

