Figure 2.

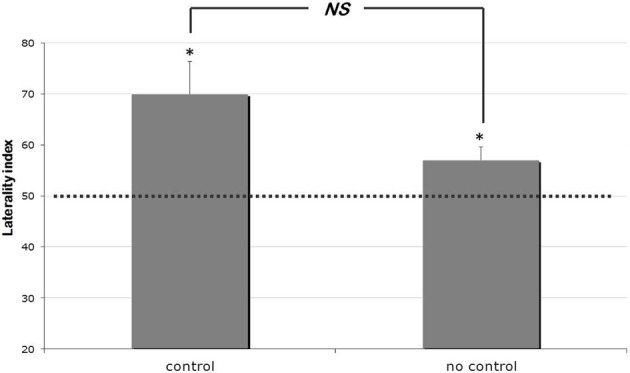
Results of Experiment 1. Percentages of laterality index (means ± s.e.m.) scored by control and no-control group of chicks. The dotted line (y = 50) represents chance level. * indicates p < 0.05.

Results of Experiment 1. Percentages of laterality index (means ± s.e.m.) scored by control and no-control group of chicks. The dotted line (y = 50) represents chance level. * indicates p < 0.05.