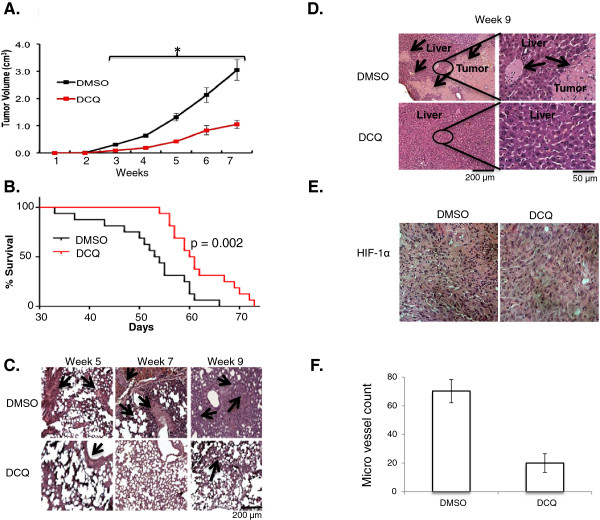
Figure 6.
DCQ reduced tumor volume and metastasis and increases survival in vivo.In vivo model used to test the effect of DCQ, briefly 4 x 10⁶ MDA-MB-231 were sub-dermally injected under the dorsal neck region of NOD-SCID mice. One week later mice were pooled into two groups DCQ treated and control. (A) Effect of DCQ on tumor growth of sub-dermally injected MDA-MB-231 mice. The growth of the primary tumor was monitored by measuring its dimensions on a weekly basis. Tumor volume (V, cm3) was determined by the equation: V = length × width × height). Data was plotted as the average tumor size of 2 separate experiments (10 mice/group/experiment) and error bars represent the standard error of the means. One-way ANOVA was used to compare DCQ-treated versus control and statistical significance of p < 0.05 is indicated by *. (B) Effect of DCQ on the survival of MDA-MB-231 injected mice. The survival curves of sub-dermally injected NOD-SCID mice by MDA-MB-231 cells, with DCQ treatment (17 mg/Kg in 50 μL DMSO) or control (in 50 μL DMSO). Experiment performed once with 22 mice per treatment group, significant difference was tested by Log-Rank Mantel-Cox test, p value = 0.002. (C) H&E staining of the lung of s.d. injected MDA-MB-231 mice was performed. Arrows indicate infiltration. (D) H&E staining of the liver samples of s.d. injected MDA-MB-231 mice was performed. Arrows indicate infiltration. (E) Photograph of primary tumor from control and DCQ-treated mice with immunohistochemistry staining against HIF-1α after 5 weeks. (F) Micro vessel density of cross section of primary tumors from control and DCQ-treated mice after 5 weeks. Results are from two mice per treatment group. Average ± SE are plotted form blinded count low magnification.

