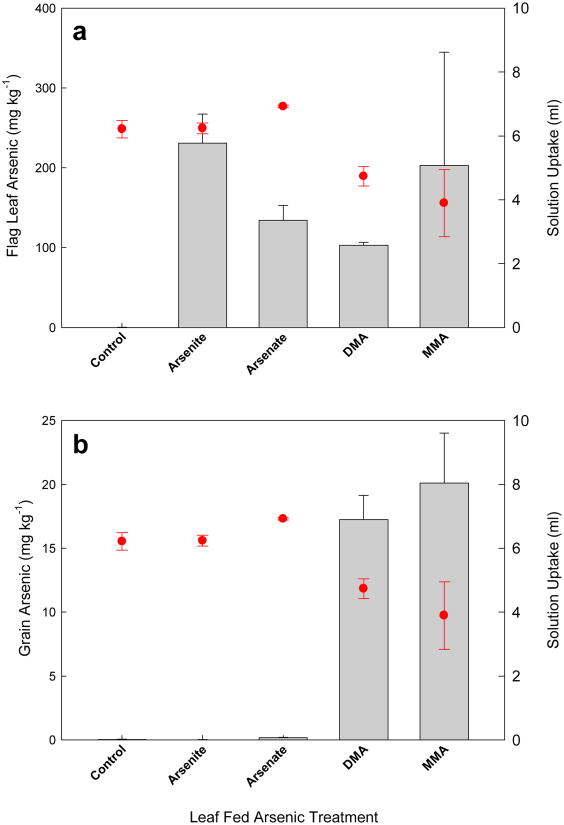
Fig. 1.
Mean total arsenic (As) concentrations (bars) in (a) flag leaf and (b) grain, for rice panicles exposed to 333 μM of 1 of 5 arsenic treatments together with 1 mM rubidium and strontium. Treatments were delivered through the cut flag leaf on intact plants for 7 d, with a fresh vial applied every 24 h. Total solution uptake is also shown for each treatment (circles). Error bars represent ± SE of three replicates.

