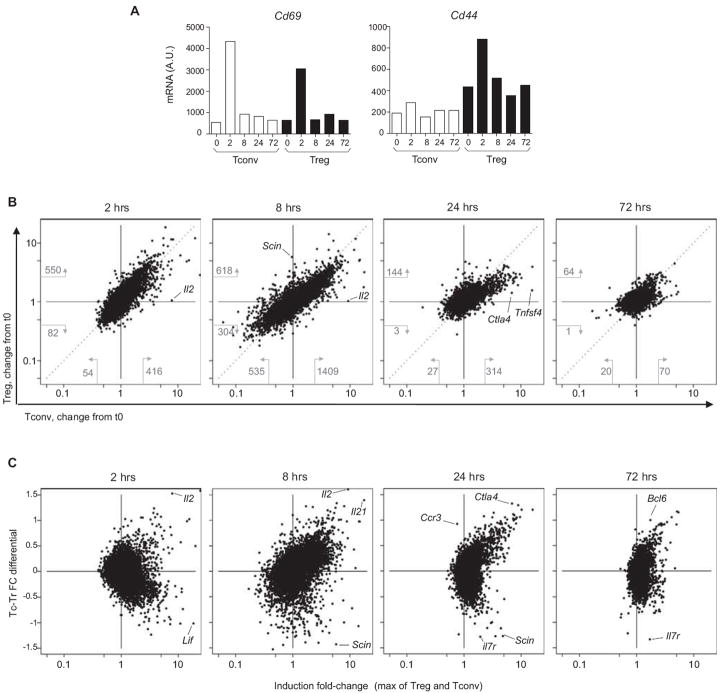
Figure 1. Tconv and Treg cell respond differently to anti-CD3.
Transcriptional profiles were generated from Tconv and Treg CD4+ splenocytes from pooled mice (n=3) at 2 to 72 hrs after treatment with anti-CD3. (A) Changes in activation markers that reflect TCR signalling. (B) Comparison of the changes elicited in Treg and Tconv cells (visualized as the ratio of expression at indicated times relative to untreated (t0)); numbers indicate the number of transcrips that change by 2.5-fold or more (B) A Tconv-Treg differential index was computed for each gene to reflect these differential changes (genes towards the top of the graph preferentially respond in Tconv, those at the bottom in Treg), and is plotted against the maximum change observed

