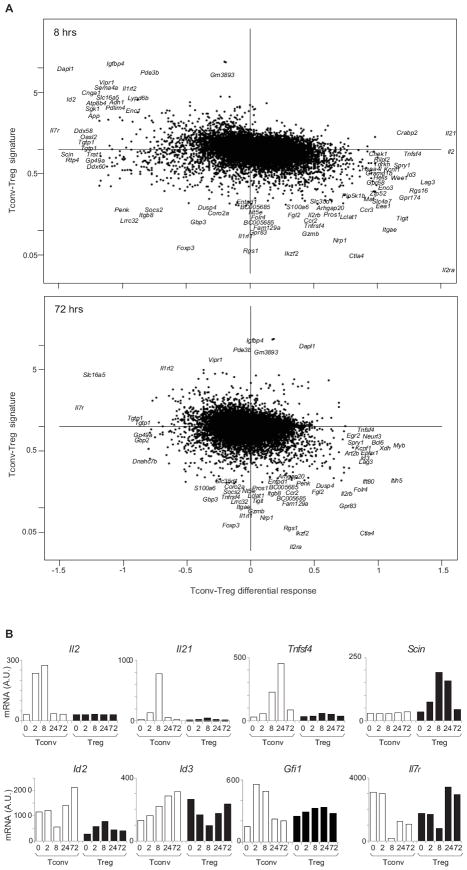
Figure 2. Elements of the differential response of Tconv and Treg to anti-CD3.
(A) The Tconv-Treg differential response, computed as in Fig1B, at 8 hrs (top panel) and 72 hrs (bottom) is plotted against the difference in expression between Tconv and Treg cells at baseline (y-axis), and the most extreme transcrips are shown by name. (B) Gene expression values (arbitrary units) for selected transcripts that are distinctively induced by anti-CD3 in Tconv and Treg cells. Values shown are average from two independent experiments.

