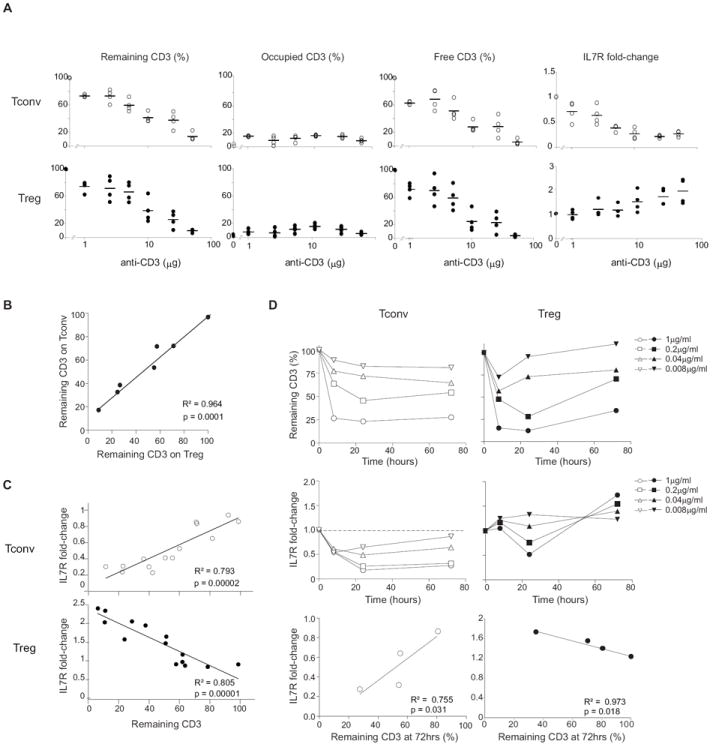
Figure 4. Inverse relationship between IL7R expression and remaining surface CD3 after anti-CD3 mAb treatment.

(A) Occupancy and clearance of CD3 molecules, and changes in IL7R expression, over a range of doses of anti-CD3. The amount of total, antibody-bound and free CD3 molecules, and of IL7R (as a FoldChange from untreated controls), on the surface of CD4+ Treg or Tconv cells was determined by flow cytometry 72 hrs after treatment with a range of doses of i.p. anti-CD3. Each dot is an individual mouse (B) CD3 molecules are similarly cleared in Treg and Tconv cells. Percent of remaining surface CD3 on Tconv and Treg cells from the same mouse, over a range of anti-CD3 doses (same experiments as Fig. 4A). (C) IL7R surface expression correlates with CD3 clearance in vivo. Changes in IL7R expression (as a FoldChange from untreated controls) plotted versus the percent of remaining surface CD3 on Tconv and Treg cells 72 hrs after treatment with a range of doses (same experiments as Fig. 4A). (D) In vitro effects of anti-CD3. Whole splenocytes were cultured with soluble anti-CD3 mAb at the concentrations shown, and remaining CD3 and IL7R expression on Tconv and Treg cells were determined at different times of culture. (E) IL7R surface expression correlates with CD3 clearance in culture. Change of IL7R expression plotted against the remaining CD3 expression on Tconv and Treg cell surface analyzed at 72 hrs of culture.
