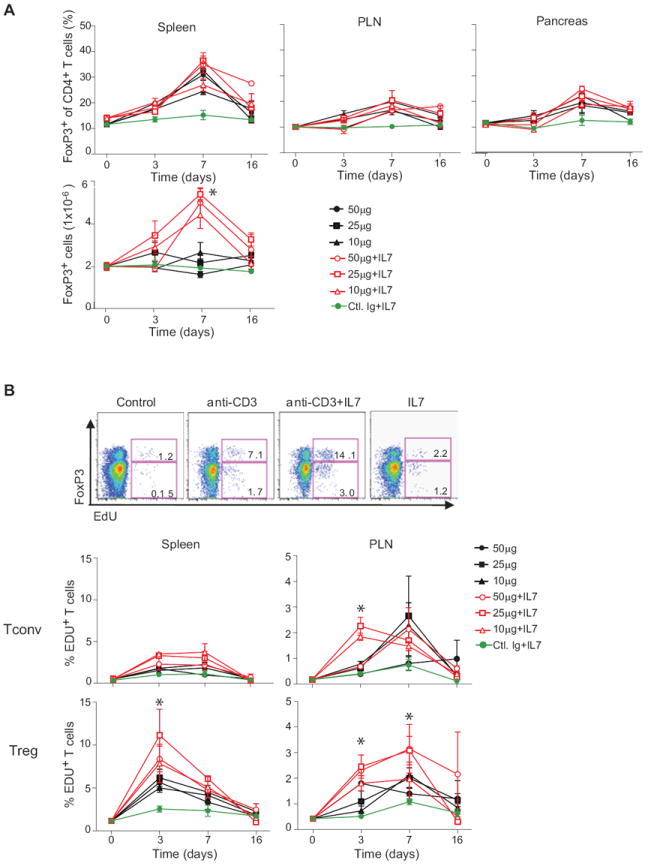
Figure 5. IL7 synergizes with anti-CD3 to induce expansion of Treg cells in vivo.

(A) Percentage and absolute numbers (bottom panel) of FoxP3+CD4+ cells in the spleen, PLN, and pancreas of anti-CD3 treated (solid symbols, doses as shown) or anti-CD3 plus IL7/anti-IL7 (0.75μg/15μg) complexes treated (open symbols); grey symbol: IL7/anti-IL7 complexes alone. *P ≤ 0.0001. Data are combined from two independent experiments with 3 mice for each dose. (B) Proliferative response. CD4+ splenocytes from mice treated as indicated untreated, anti-CD3, anti-CD3 plus IL7, or control IgG and IL7 treated were analyzed by flow cytometry, 6 hrs after administration of with. EdU; top: profiles representative of 3 independent experiments. Bottom: time course analysis in response to graded doses of anti-CD3 alone or in combination with IL7/anti-IL7 complexes. *P ≤ 0.01. Data are combined with two independent experiments with 3 mice for each dose.
