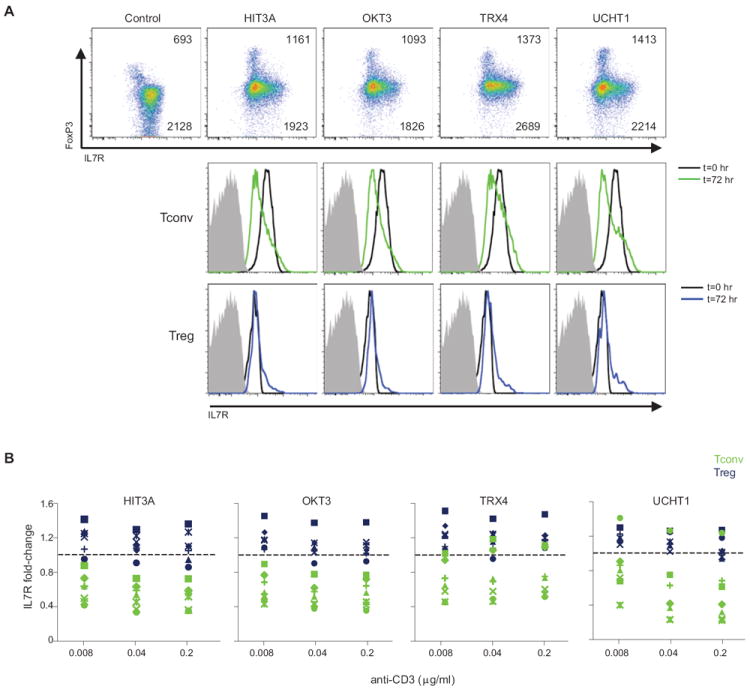
Figure 7. Differential IL7R expression on Tconv and Treg cells from human blood in response to anti-CD3.

PBMCs from healthy volunteers were treated in culture with soluble anti-CD3 (4 different mAbs), and IL7R expression assessed in Treg and Tconv cells after 72 hrs by flow cytometry (A) Top: Scatter plots of FoxP3 and IL7R staining, values are MFI in FoxP3hi and FoxP3- cells; bottom: corresponding overlaid histograms. (B) Similar responses in Treg and Tconv cells from several independent donors. Changes in IL7R expression at 72 hrs (as FoldChange relative to t=0 control) induced by the different anti-CD3 mAbs on blood Tconv (green) and Treg (blue) from seven Caucasian donors.
