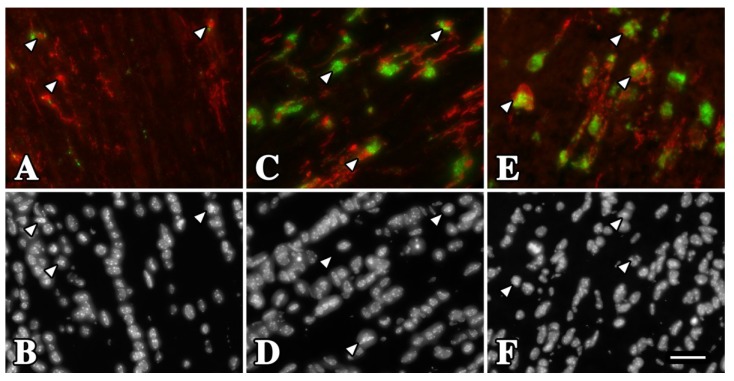
Figure 4.
Activation of rsh and msd microglia/macrophages in optic nerve at P16. (A) Longitudinal section from wild type mouse reveals Iba-1+ microglia/macrophages (red) with non-activated morphology (arrowheads). Most of these cells do not express CD68 or express the protein at low levels (green). (B) DAPI staining showing the nuclei of the microglia/macrophages in (A). (C, E) Iba-1+ microglia/macrophages from rsh (C) and msd (E) mice exhibit an activated morphology with enlarged cell bodies and thickened processes. Most of these cells express CD68 at high levels, which is localized to perinuclear regions. (D, F) DAPI staining of the fields in (C, E). Scale bar in F: 30 μm.

