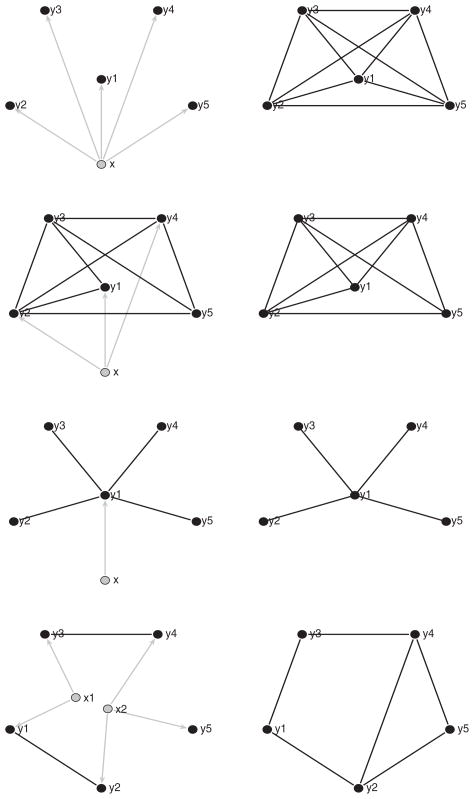
Figure 2.
Conditional and unconditional graphical models in Examples 2 and 3. Left panels: the conditional graphical models. Right panels: the corresponding unconditional graphical models. Black nodes indicate response variables; gray nodes are the predictors. Edges in the conditional and unconditional graphs are indicated by black lines; regression of Y on X is indicated by directed gray lines with arrows. (The online version of this figure is in color.)

