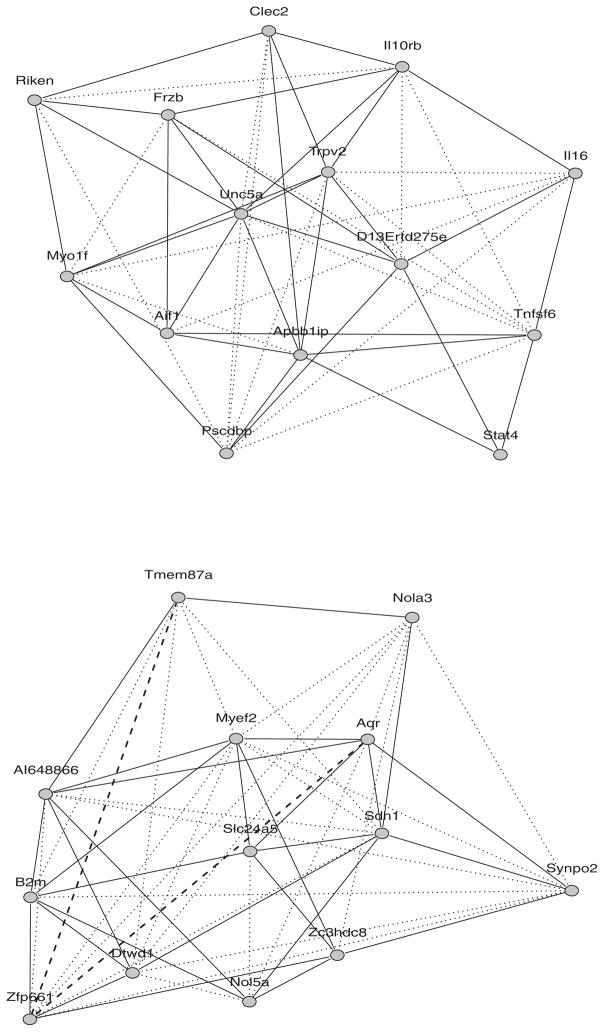
Figure 4.
Gene networks based on GGM and CGGM. Upper panel: data based on co mapping selection. Lower panel: data based on coexpression selection. An edge from both GGM and CGGM is represented by a solid line; an edge from the GGM alone is represented by a dotted line; an edge from CGGM alone is represented by a broken line. (The online version of this figure is in color.)

