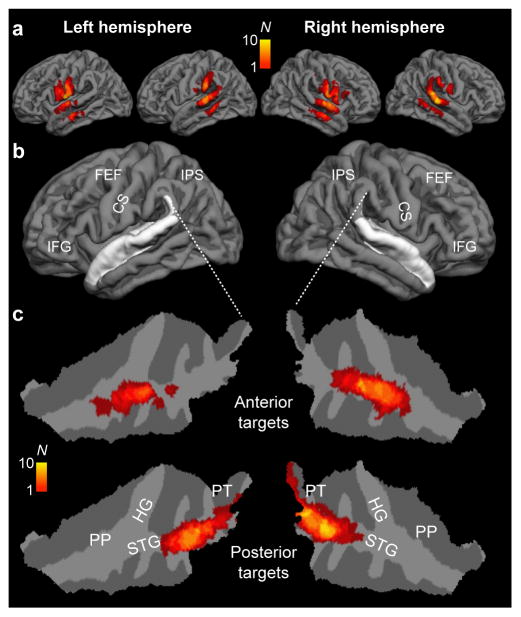
Figure 4.
Modeling of TMS-induced E-fields in the cortex. (a) Distribution of TMS effects exceeding 80% motor threshold (MT) strength during TMS in all subjects (N=10), shown on a standard brain cortical reconstruction. (b) Gross anatomical landmarks of interest shown on the standard-brain cortex. The location of superior temporal cortices, which encompass ACs has been shown in white. The loci of central sulcus (CS), and extra-AC areas related to “what” (inferior frontal gyrus, IFG) and “where” (intraparietal sulcus, IPS; frontal eye fields, FEF) processing streams are also shown. (c) TMS-induced electric fields in AC on flattened patches of the superior temporal cortices. Taken together, our modeling results demonstrate that TMS-induced E-fields were successfully delivered at the posterior (posterior STG, PT) vs. anterior AC areas (anterior STG, PP), hypothesized to be associated with sound location vs. identity feature discrimination, respectively. As expected, TMS also induced E-fields in the adjacent cortical gyri. However, the panel a shows that these fields were not close to the frontoparietal areas typically associated with extra-AC “where” (IPS/FEF) and “what” (IFG) processing. The color scale depicts the number of subjects with stimulation reaching the threshold at a given location.

