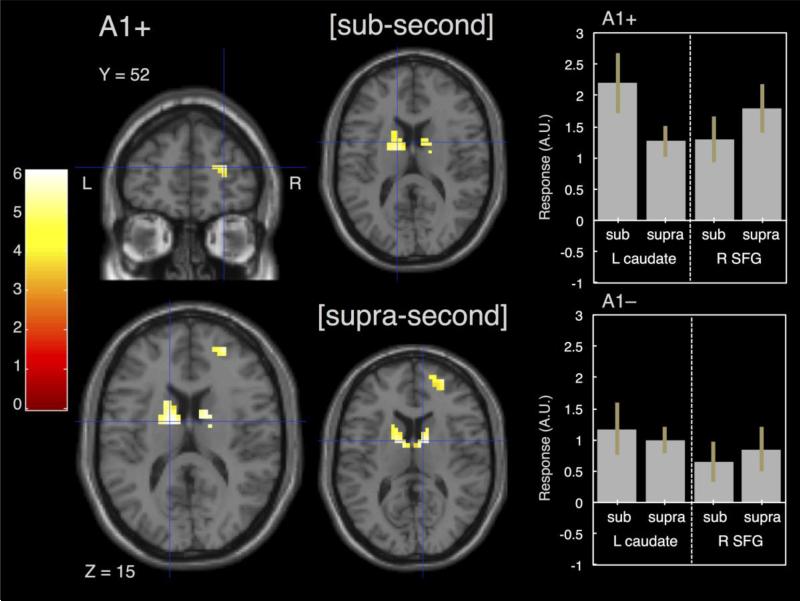
Figure 3.
Effect of genotype on activation during the TIME condition. In a comparison between A1+ and A1- genotypes, only A1+ subjects exhibited significant activation, exclusively in the bilateral basal ganglia and right dorsolateral prefrontal cortex. When dividing this contrast into sub and supra-second duration intervals, A1+ subjects exhibited basal ganglia activation for both ranges, but only right prefrontal activation for supra-second intervals. A1- subjects did not exhibit any differences at either range. All contrasts were masked by the TIME vs. COLOR regression contrast and are significant at p<0.001, uncorrected. Right panels display mean parameter estimates (β values) for A1+ and A1- groups in left caudate and SFG for sub and supra-second intervals, error bars indicate standard error.

