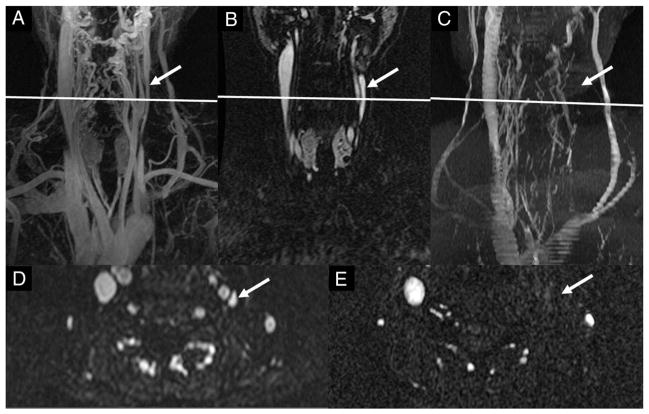
Fig. 2.
MS patient where the 3D CE MRAV shows very different results from the 2D TOF-MRV. (A) Coronal MIP (72 slices) of the time-resolved 3D CE MRAV where the LIJV is clearly visualized (left arrow). (B) Single slice image from the 3D CE MRAV. (C) MIP of the 2D TOF-MRV data where the LIJV shows no signal. (D) Axial slice of the 3D CE MRAV which corresponds to A and B and shows signal in the LIJV (arrow). (E) Axial 2D TOF-MRV slice which corresponds to C and shows no signal in the LIJV.

