
Figure 2.
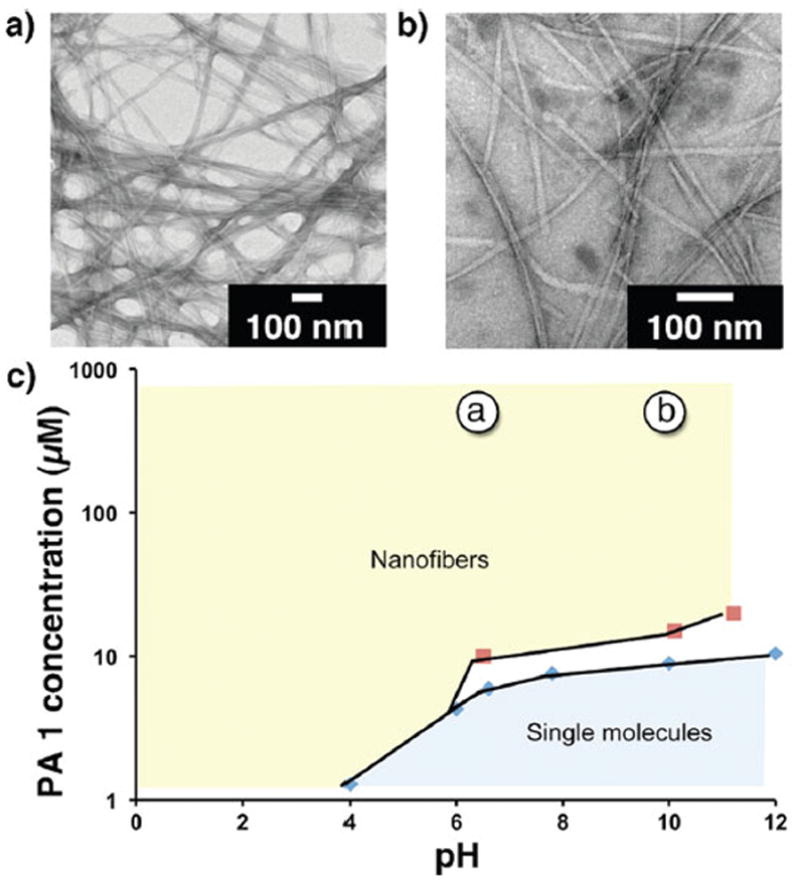
TEM images of 0.5 mM of PA1, measured pH (a) 6.0 and (b) 10.0. (c) Concentration–pH self-assembly phase diagram of PA1 as determined via CAC (blue diamonds) and CD (red squares) measurements. All samples were prepared in 150 mM NaCl and 2.2 mM CaCl2. The concentration and pH values at which the TEM images were obtained are labeled in (c). The white area corresponds to a region where the self-assembled morphology is uncertain due to the lack of suitable experimental techniques.