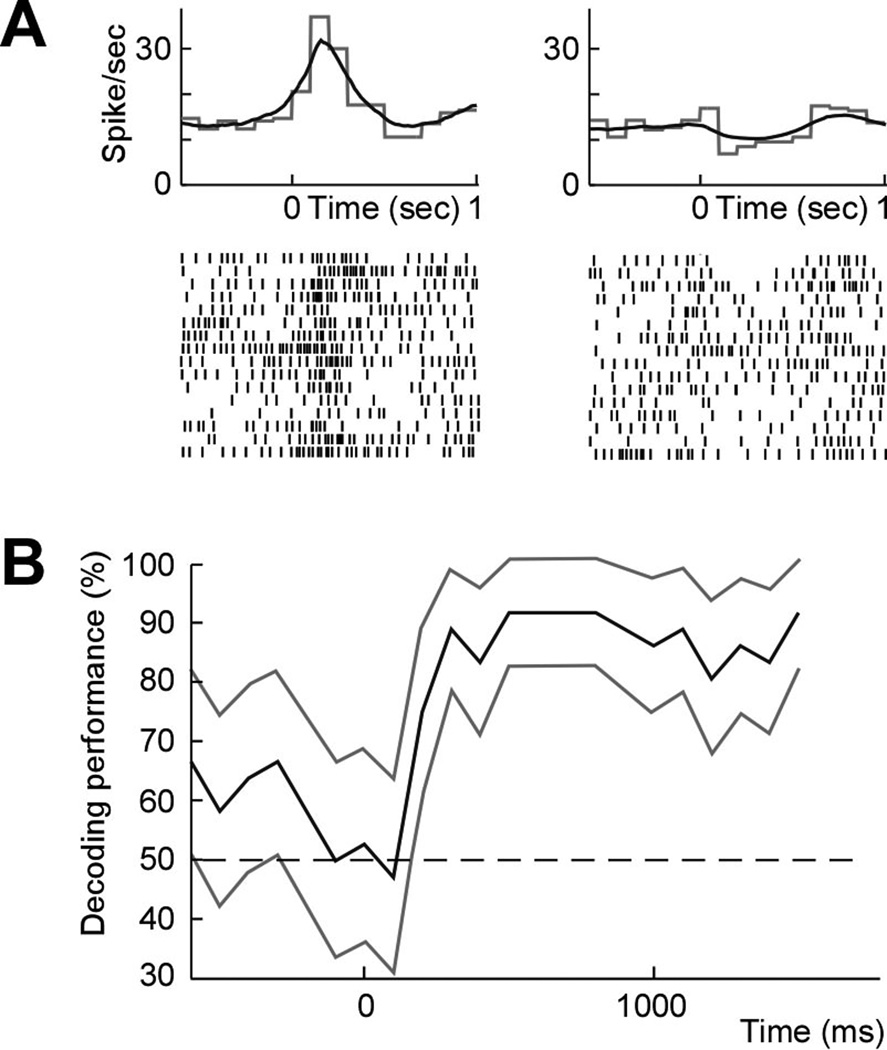
Figure 3.
Neural population decoding. (a) Averaged (gray) and model estimated (black) peristimulus histogram (top) and raster (bottom) of a pre-motor neuron during movement planning and aligned to presentation of two different targets (left and right, respectively). (b) Mean population decoding performance across all trials and 95% confidence bounds aligned to target presentation (and up to the go-cue) during a sample session.

