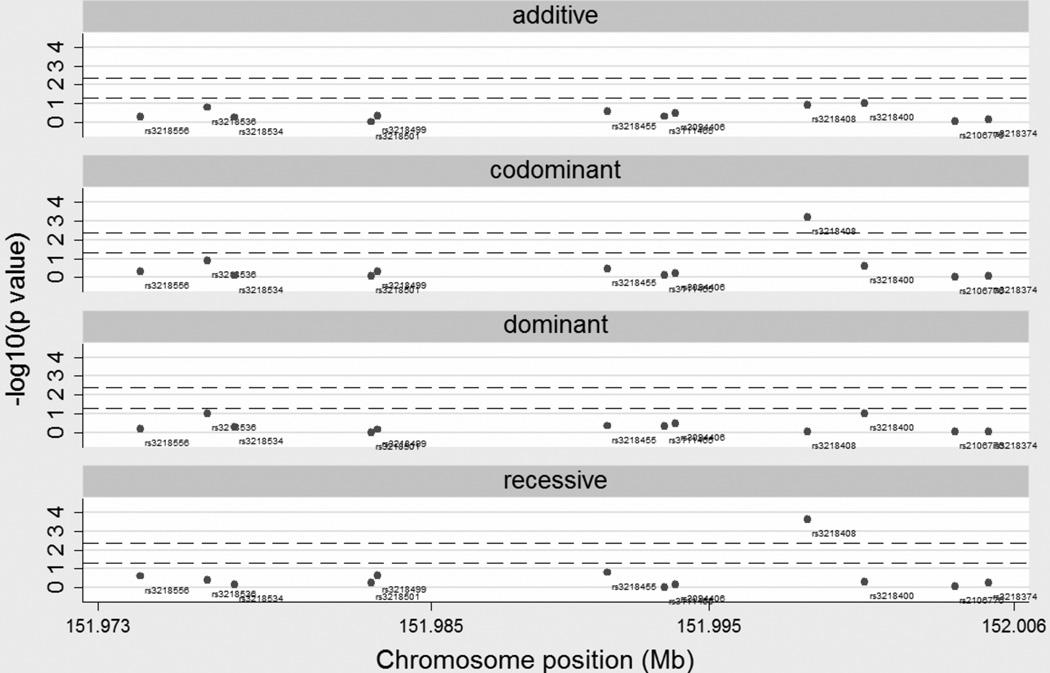
Figure 1.
Negative log10 p values for additive, codominant, dominant and recessive models for the XRCC2 SNPs in the SBCS. For each model the upper dash line represents the Bonferroni threshold of 4.2×10⁻³ and the lower dash line represents the nominal significant value of 0.05. Chromosome positions are given in Mb and refer to NCBI build36/hg18 of the human genome

