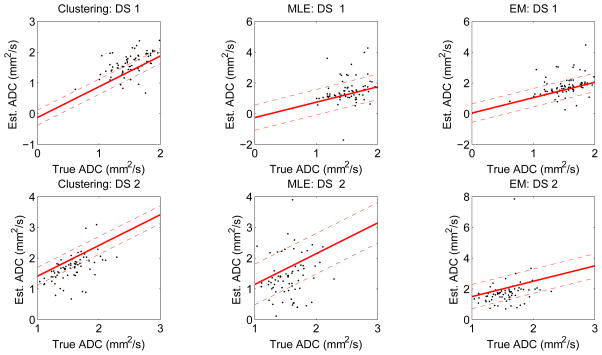
Figure 1.
The regression lines estimated using the no-gold-standard method for the three segmentation algorithms and for the two simulated lesion datasets: DS1 and DS2. In these two datasets, the true ADC values were sampled from a normal distribution. The solid line is generated using the estimated linear model parameters, and the dashed line denotes the estimated standard deviation. The scatter plots show the computed ADC values vs. the true ADC value. ADC values are in units of mm2/103s. Note that although we have plotted the true ADC value on the x axis of the graph, this information was not used in computing the linear model parameters.

