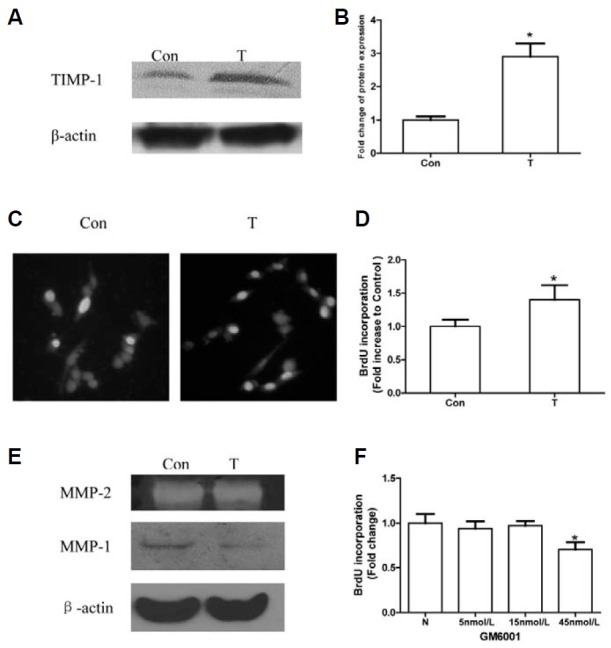
Fig. 1. TIMP-1 plasmid transfection stimulates NIH3T3 cell proliferation independent of MMP system. “Con” refers to cells transfected with the control plasmid. “T” refers to cells transfected with the TIMP-1 plasmid. (A) TIMP-1 protein is over-expressed in the T group compared with the Con group, as evaluated by Western blotting. (B) The TIMP-1 protein expression in control group and TIMP-1 group are quantified by densitometry analysis. TIMP-1 band intensities are presented as the ratios to the β-actin levels. The band intensity in the Con group is arbitrarily set as 1.0, *p < 0.05 versus the Con group. (C) Representative images of BrdU staining in Con and T group are shown. Blue cell nuclei are considered as BrdU positive, Total cell nuclei are stained with Hoechst 33258. (D) The NIH3T3 proliferation rate is higher in the T group than in the Con group, as evaluated by BrdU incorporation assays. BrdU positive rate of Con is arbitrarily set as 1.0, *p < 0.05 versus the Con group. (E) TIMP-1 has little effect on the activity of MMP-2 when detected by gelatin zymography, but it could inhibit the expression of MMP-1 when detected by western blot. (F) There are no differences among N cells (normal group) and cells treated with 5 or 15 nM GM6001. There is a lower BrdU-positive rate in cells treated with 45 nM GM6001 com pared with the normal group. BrdU positive rate of N is arbitrarily set as 1.0, *p < 0.05 versus the N group.

