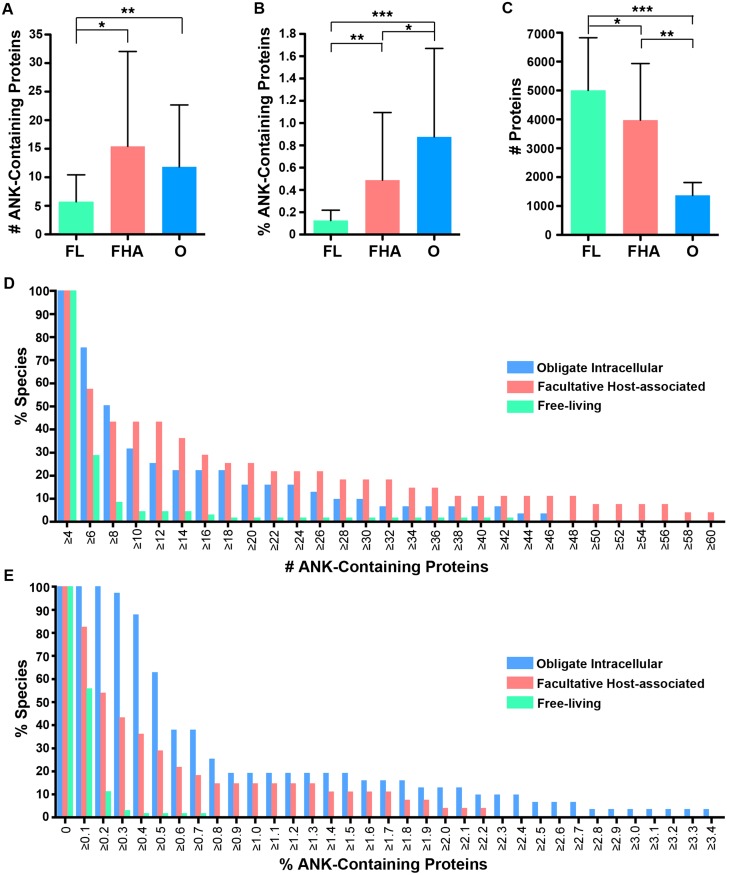
Figure 4. Lifestyle analysis of bacterial species with four of more ANK-containing proteins.
An average of the number or percent of ANK-containing proteins for all strains of the same species was used for these analyses. FL, FHA and O denote free-living, facultative host-associated and obligate intracellular bacteria, respectively. (A) Bar graph of the average number of ANK-containing proteins in species with four of more ANK-containing proteins. Error bars represent standard deviation. (*P < 0.001, **P < 0.00001, Two-tailed Mann-Whitney U; ANOVA, P < 0.00003). (B) Bar graph of the average percent of the proteome composed of ANK-containing proteins in species with four of more ANK-containing proteins. Error bars represent standard deviation. (*P 0.001, **P < 0.0001, ***P < 0.00001, Two-tailed Mann-Whitney U; ANOVA, P < 0.00001). (C) Bar graph of the average total number of proteins in the proteomes of species with four of more ANK-containing proteins. Error bars represent standard deviation. (*P < 0.01, **P < 0.00001, ***P < 0.000001, Two-tailed Mann-Whitney U; ANOVA, P < 0.00001). (D) Bar graph of percent of species in each lifestyle that contain the specified number of ANK-containing proteins (example: 74% of obligate intracellular species, 58% of facultative host associated species, and 28% of free-living species of bacteria contain six ANK-containing proteins). (E) Bar graph of the percent of species in each lifestyle that contain the specified percent of ANK-containing proteins.

