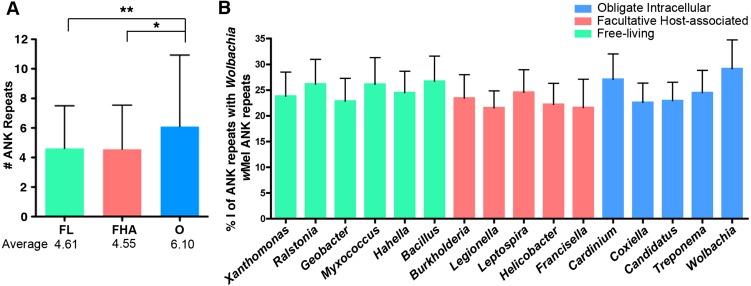
Figure 5. Individual ANK repeat number and amino acid sequence identity analysis.
(A) Bar graph of the average number of ANK repeats in ANK-containing proteins for free-living (FL), facultative host-associated (FHA) and obligate intracellular (O) bacteria. Error bars represent standard deviation (*p = 0.0127, **p = 0.0036, t-test). For a list of strains analyzed, refer to Table S6. (B) Bar graph of the average percent of amino acid identity of the ANK repeats from the listed species with Wolbachiaw Mel ANK repeats. Strains analyzed listed in Table S8. Error bars represent standard error.

