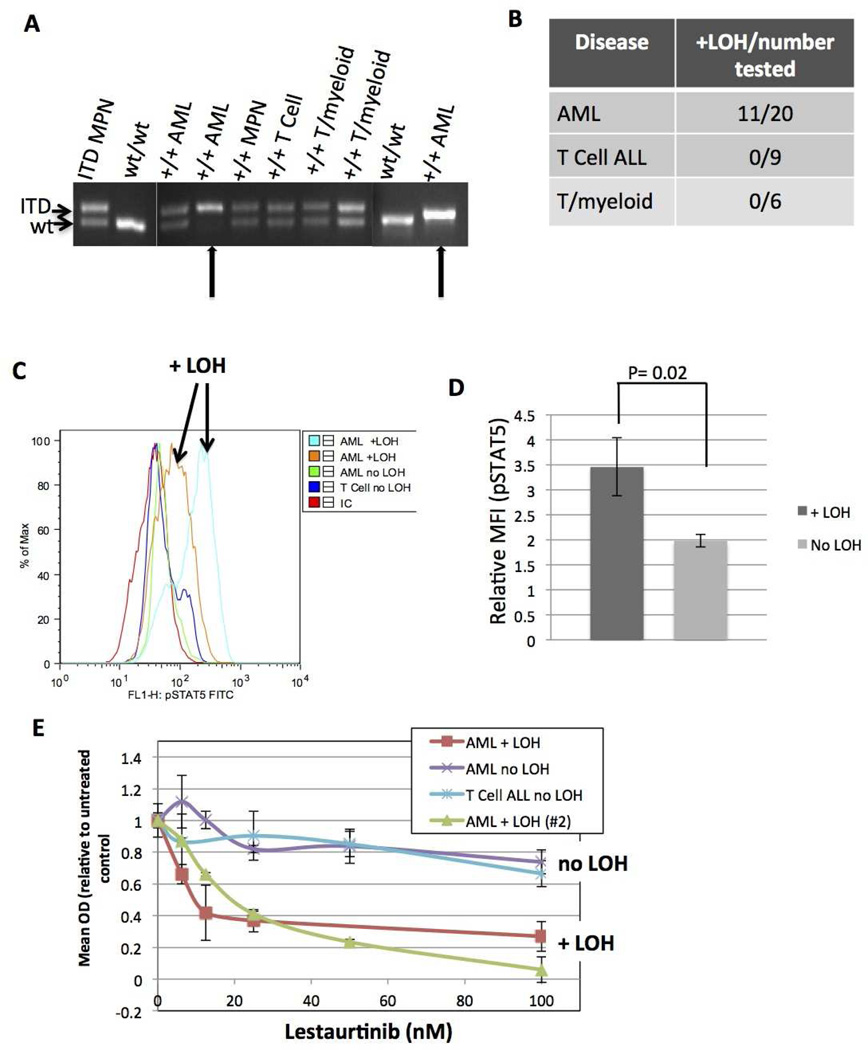
Figure 5. Loss of heterozygosity (LOH) of the wild-type Flt3 allele is common in myeloid leukemia and is functionally significant.
A) PCR of DNA extracted from BM showing examples of mice that remain heterozygous for wild-type Flt3 and 2 mice with AML that have LOH of the wild-type allele (arrows). Image shows 3 separate gels, separated by white lines. B) Table of leukemic mice showing proportion of each disease type with LOH. C) Representative histogram demonstrating measurement of intracellular pSTAT5 detected by intracellular flow cytometry in mice with and without LOH. D) Quantification of all pSTAT5 experiments comparing mice with (N=8) and without (N=9) LOH. E) WST1 cytotoxicity assay dose-response curves comparing sensitivity to Flt3 inhibition by the Flt3 inhibitor lestaurtinib in mice with and without LOH.
LOH, loss of heterozygosity of wild-type Flt3; pSTAT5, phosphorylated STAT5.

