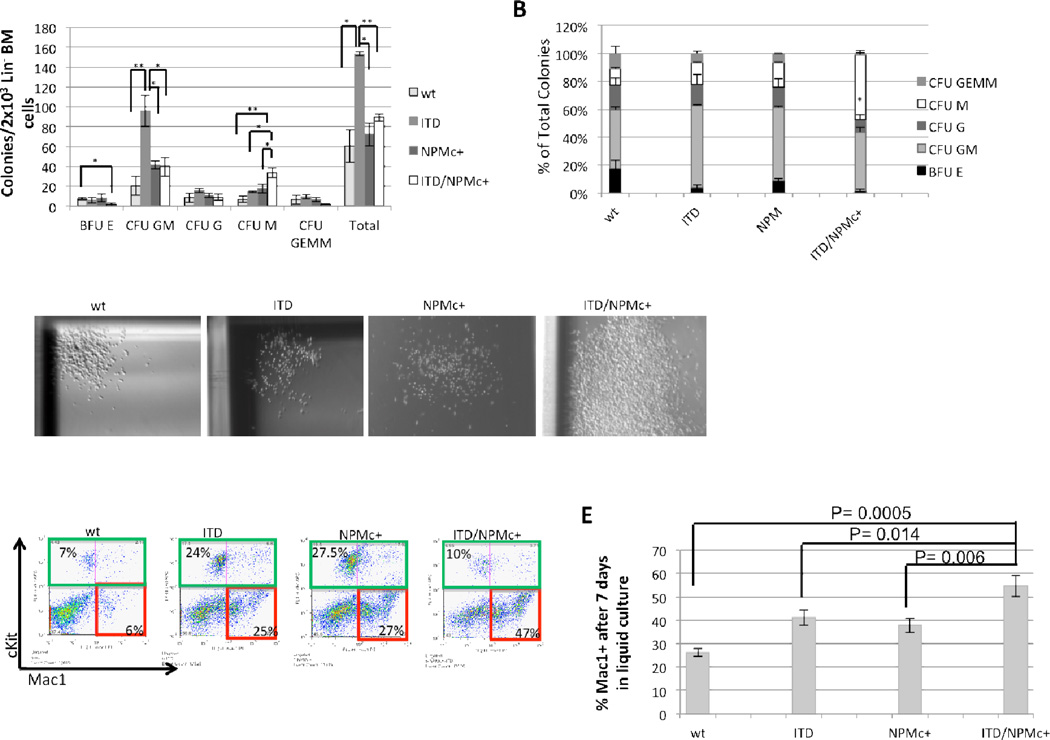
Figure 7. BM from ITD/NPMc+ mice demonstrates enhanced monocytic colony-forming activity in vitro.
Methylcellulose in vitro colony-forming assay of lineage-depleted BM cells from 2-month-old mice. A) Total colony counts and B) percentage distribution of colony type by genotype. Data are the results from 3 independent experiments. Data are expressed as means (bars) plus or minus SEM (error bars). ** P<0.01, * P<0.02. C) Representative CFU-M colonies generated from wt, ITD, NPMc+, and ITD/NPMc+ lineage-depleted BM. Original magnification 20×. D) Representative flow cytometric analysis of cells collected from plates 10 days after the first plating with percentage of cKit+ (green outline) and Mac1+/cKit− (red outline). E) Flow cytometry of lineage-depleted BM cells from 2-month-old mice after 7 days of culture in RPMI 1640 plus SCF, IL3, and IL6. Data are the results from 3 independent experiments. Data are expressed as means (bars) plus or minus SEM (error bars).

