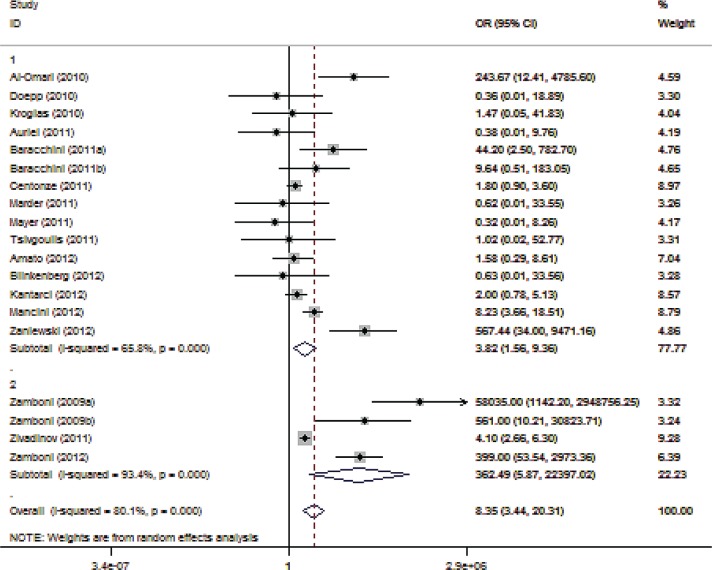
Supplemental Figure 6.
Forest plot describing the results of the sensitivity analysis #1 (modifying role mediated by Zamboni’s group). Upper panels: studies which did not include authors coming from Zamboni’s group or coming from groups that have previously cooperated with Zamboni (n=15); Lower panels: studies related to Zamboni’s group (n=4).

