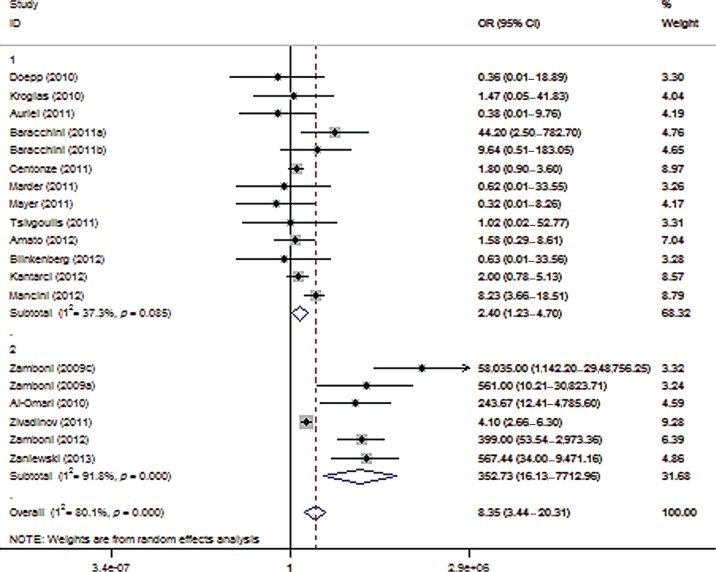
Figure 3.
Forest plot describing the results of sensitivity analysis 3 (modifying role mediated by the involvement with the Liberation procedure). Upper panels: studies conducted by investigators not involved in the Liberation procedure (n = 13); Lower panels: studies conducted by investigators involved in the Liberation procedure (n = 6). CI, confidence interval; OR, odds ratio.

