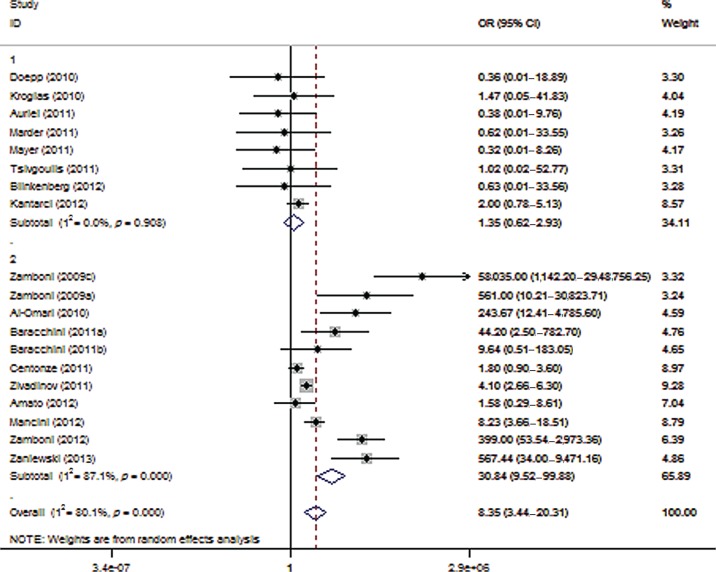
Figure 4.
Forest plot describing the results of the combined sensitivity analysis (modifying role mediated by recruitment of Italian patients or involvement with the Liberation procedure). Upper panels: studies conducted by investigators not involved in the Liberation procedure and not recruiting Italian patients (n = 8); Lower panels: studies conducted by investigators involved in the Liberation procedure or recruiting Italian patients (n = 11). CI, confidence interval; OR, odds ratio.

